Figure 1.

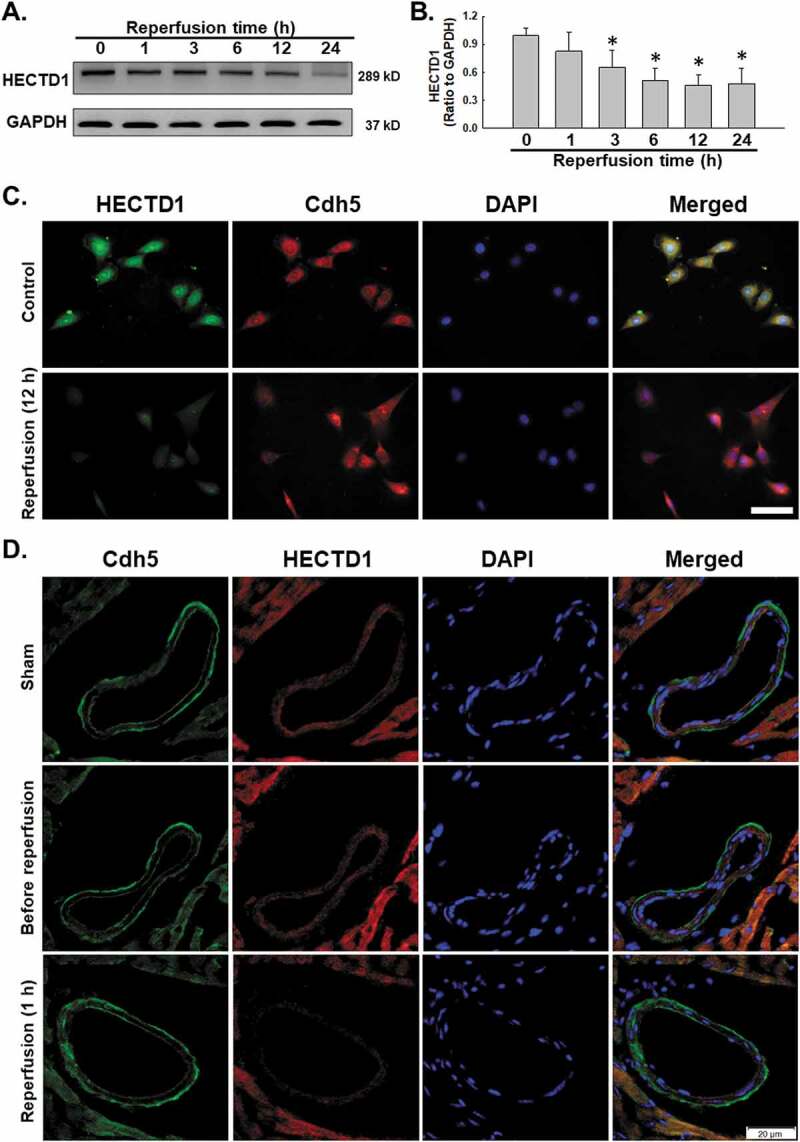
I/R decreased HECTD1 expression. (A) Representative western blots showing that I/R induced HECTD1 expression in a time-dependent manner in HUVECs. (B) Densitometric analyses of HECTD1 levels from five independent experiments; *P < 0.05 compared with the 0 h group. (C) Representative images of immunocytochemical staining showing that I/R induced HECTD1 expression in HUVECs. Scale bar, 100 μm. (D) Representative images of immunohistochemical staining showing that Cdh5 colocalization with HECTD1 decreased in mouse heart vessels after I/R. Scale bar, 20 μm.
