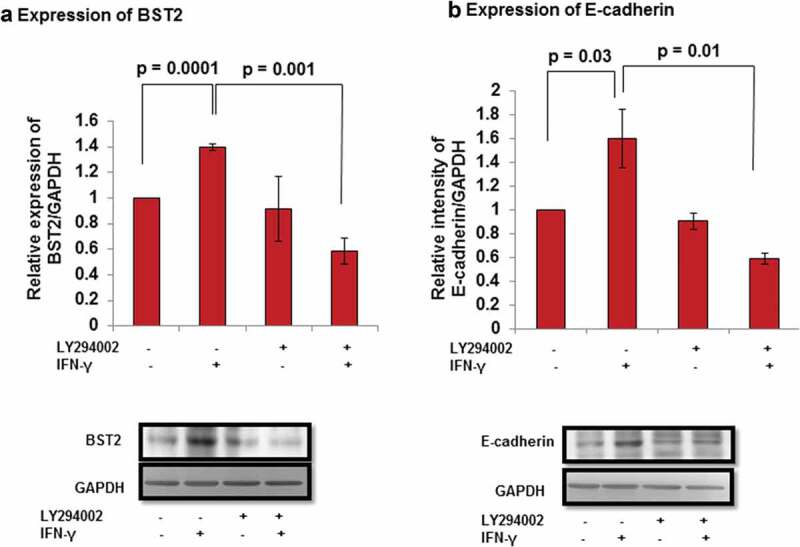
Figure 10.

Expression of BST2 and E-cadherin after AKT inhibition in HTR-8/SVneo cells treated with IFN-γ. HTR-8/SVneo cells (0.1 × 10⁶/well) were cultured overnight in 6-well cell culture plate at 37°C in 5% CO2 and 70% relative humidity. The next day, cells were pretreated in the presence and absence of LY294002 (50 μM) for 2 h followed by treatment with IFN-γ (10 ng/mL) for 24 h and used to study the expression of BST2 and E-cadherin by Western blotting as described in Materials and Methods. Panel a shows the bar graph of BST2 at the protein level in untreated and pretreated LY294002 cells, respectively, on treatment with and without IFN-γ. Panel b shows the expression of E-cadherin at the protein level in untreated and LY294002 pretreated cells, respectively, on subsequent treatment with and without IFN-γ. Each bar represents relative expression after normalization with GAPDH with respect to LY294002 untreated control cells and without treatment of IFN-γ. Values are expressed as mean ± SEM of three independent experiments. Representative blots of BST2, E-cadherin, and GAPDH from one of the three independent experiments are appended with respective panels.
