
Figure 2.
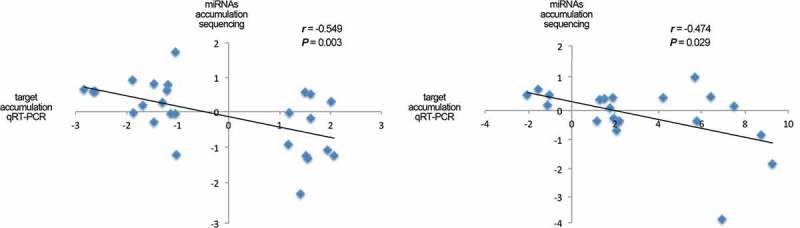
Validation of functional miRNA-targets interactions by qRT-PCR assay. Scatter plot showing the significant negative correlation (estimated by Pearson correlation coefficient) between the expression levels of selected stress-responsive miRNAs with differential accumulation determined by sequencing data and the accumulation of their predicted targets in the corresponding stress situations estimated by qRT-PCR (detailed information in Table S15).