
Figure 3.
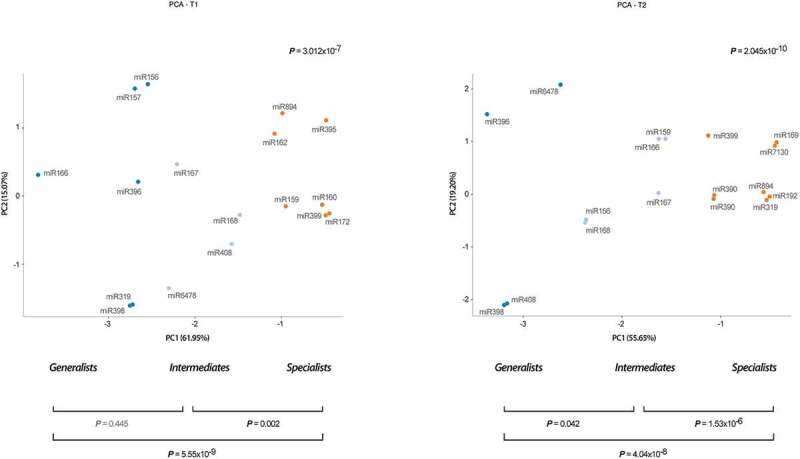
Stress-responsive miRNAs are hierarchically organized in relation to its response-range to stress. Principal component analysis of stress-responsive miRNAs detected in melon plants at both analysed times T1 (left panel) and T2 (right panel). Values of proportion of variance for PC1 and PC2 are showed y the X and Y-axis. The statistical significance of the identified clusters was estimated by Mann-Whitney-Wilcoxon test, considering the inter- and intra-group Euclidean distances (P-values are showed in the graphic). The different groups of stress-responsive miRNAs detected in melon are identified by colours: broad response-range (deep blue), intermediate (light blue) and narrow (orange).