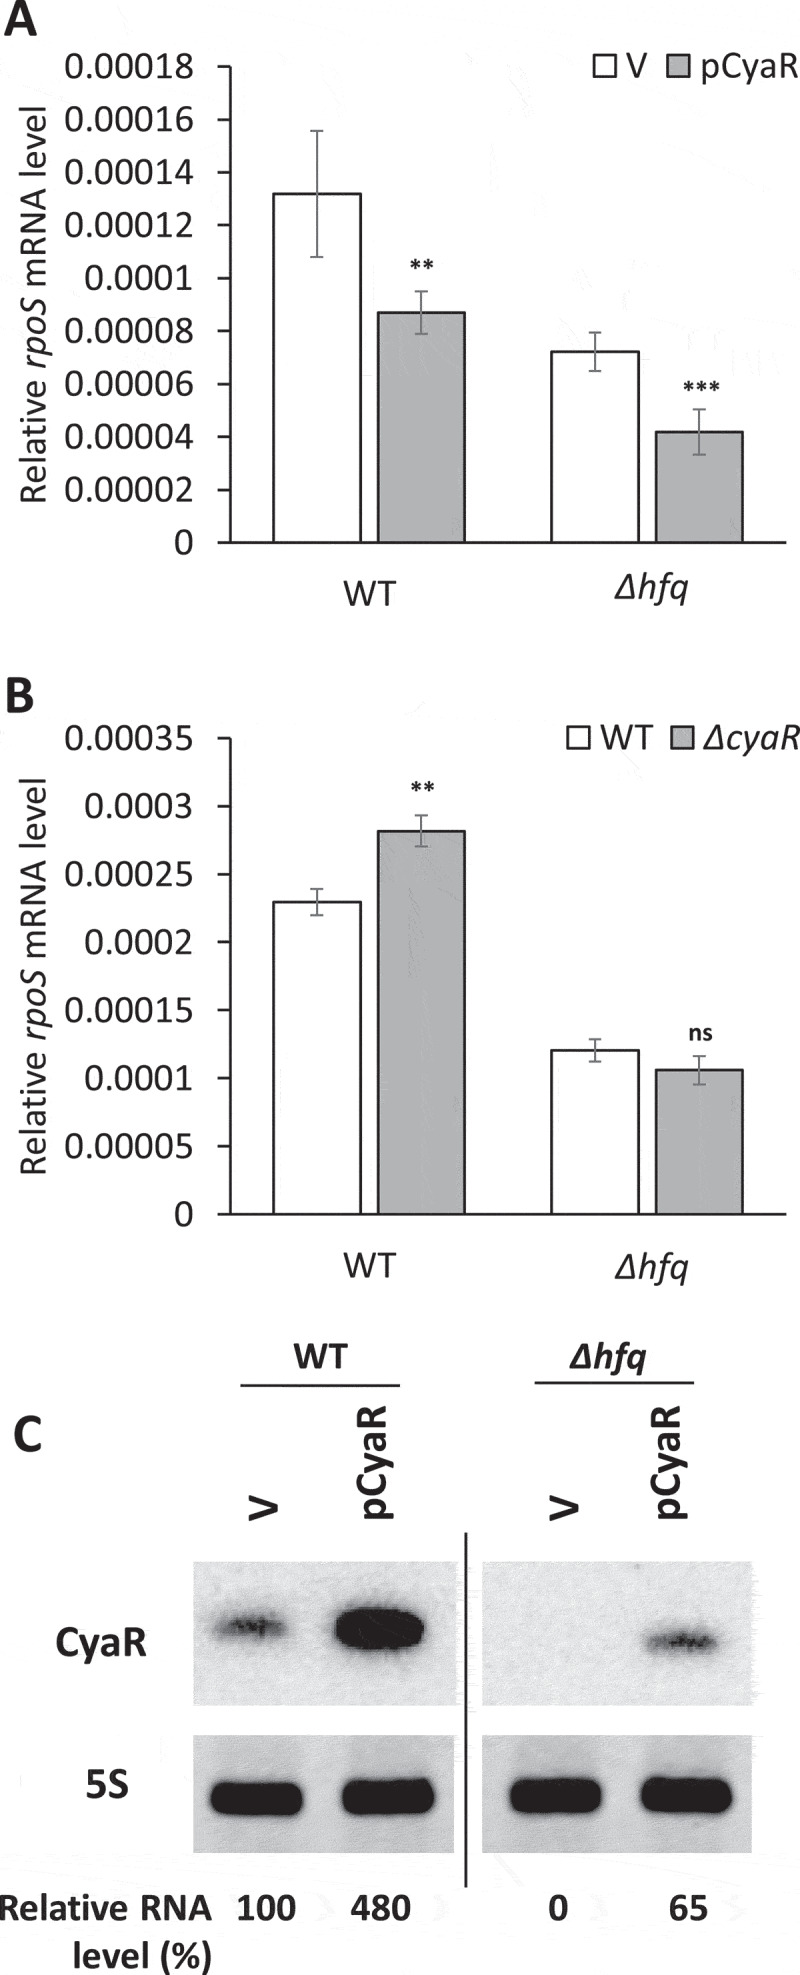
Figure 3.

Hfq-independent rpoS repression by CyaR. The rpoS mRNA levels upon CyaR overexpression (A) and the ΔcyaR mutation (B) in Δhfq cells. The rpoS mRNA levels were measured by qRT-PCR and normalized to rrsA expression. Values are means ± SD; n = 3; ***P < 0.001, **P < 0.01 by Student’s t-test. (C) CyaR levels were measured by Northern blot analysis. CyaR was probed with an anti-CyaR oligonucleotide; 5S rRNA is shown as a loading control. CyaR RNA quantities are expressed relative to vector controls for each strain. The spliced image from the same Northern blot membrane is shown with a dividing line inserted between spliced lanes. WT, PM1409; Δhfq, PM1409Δhfq; ΔcyaRΔhfq, PM1409ΔcΔh; V, vector control.
