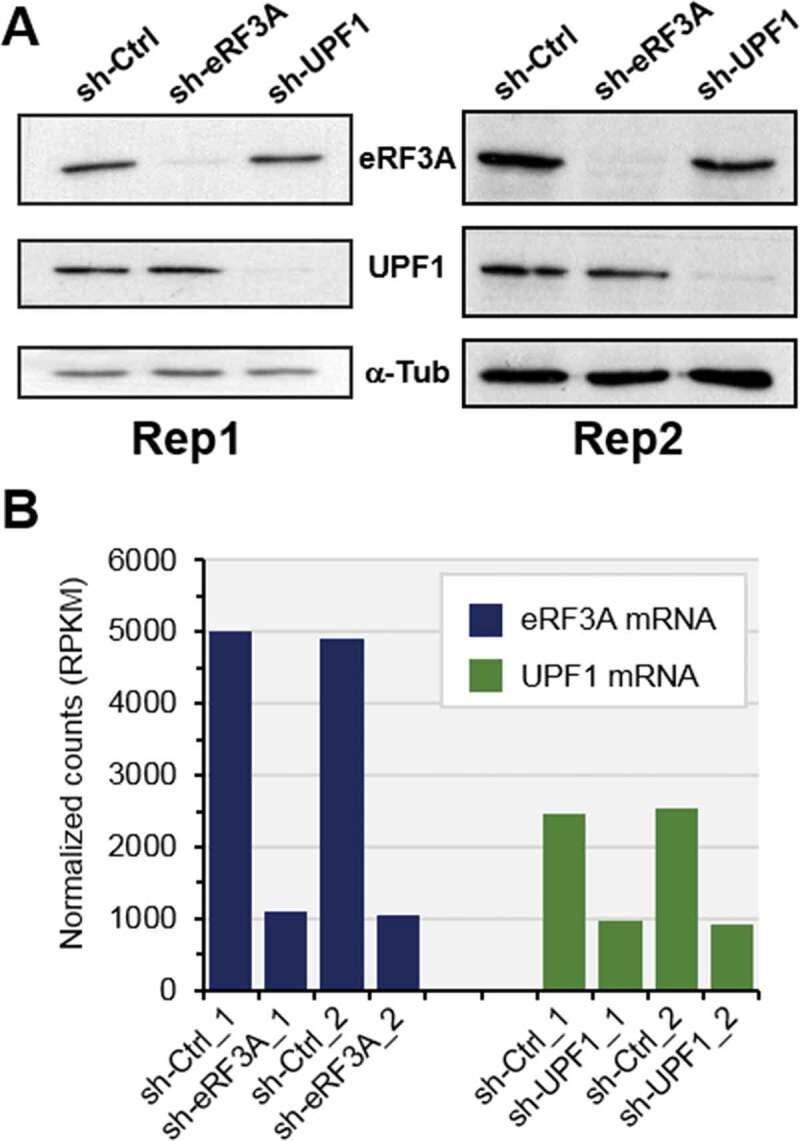
Figure 1.

Monitoring of eRF3A and UPF1 knockdown in HCT 116 cells. (A) Western blot analysis of eRF3A and UPF1 in the two biological replicates (Rep1 and Rep2) of eRF3A-depleted cells (sh-eRF3A), UPF1-depleted cells (sh-UPF1) and control cells (sh-Ctrl); α-Tubulin (α-Tub) served as a loading control. (B) eRF3A and UPF1 mRNA levels in eRF3A-depleted (sh-eRF3A) and UPF1-depleted (sh-UPF1) and control (sh-Ctrl) cells for the two biological replicates of RNAseq experiments; normalized counts are expressed in RPKM (reads per kilobase million).
