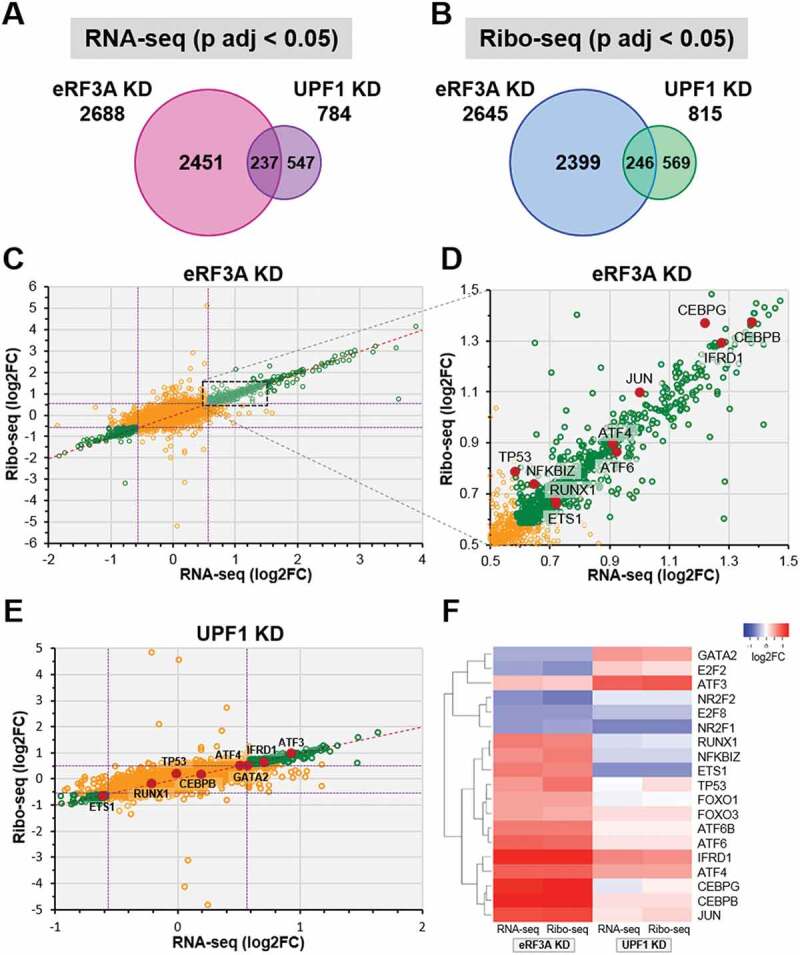
Figure 2.

Comparison of differentially expressed genes in eRF3A and UPF1 knockdown cells. (A and B) Proportional Venn diagrams showing the overlap of differentially expressed genes (adjusted p‐value, p adj < 0.05, DESeq2) between eRF3A knockdown and UPF1 knockdown targets for RNA-seq (A) and Ribo-seq (B) data. For each Venn diagram, the number of differentially expressed genes are indicated. (C) Scatter plot comparing Ribo-seq (y axis) and RNA-seq (x axis) log2 Fold Change (log2FC) for eRF3A-depleted versus control cells (eRF3A KD). Green circles indicate genes with p adj < 0.05, dotted purple lines indicate 1.5 fold change (log2FC = ± 0.585). (D) Enlargement of the dotted rectangle in C. Some transcriptional regulator genes are indicated by red dots. (E) Scatter plot comparing Ribo-seq (y axis) and RNA-seq (x axis) log2 Fold Change (log2FC) for UPF1-depleted versus control cells (UPF1 KD). Green circles indicate genes with p adj < 0.05, dotted purple lines indicate 1.5 fold change. Some transcriptional regulator genes are indicated by red dots. (F) Expression heatmap of a selection of transcriptional regulators for eRF3A and UPF1 knockdown cells. Heatmap was performed using Heatmapper website http://www2.heatmapper.ca/expression/[85] and Complete Linkage clustering method.
