Figure 3.

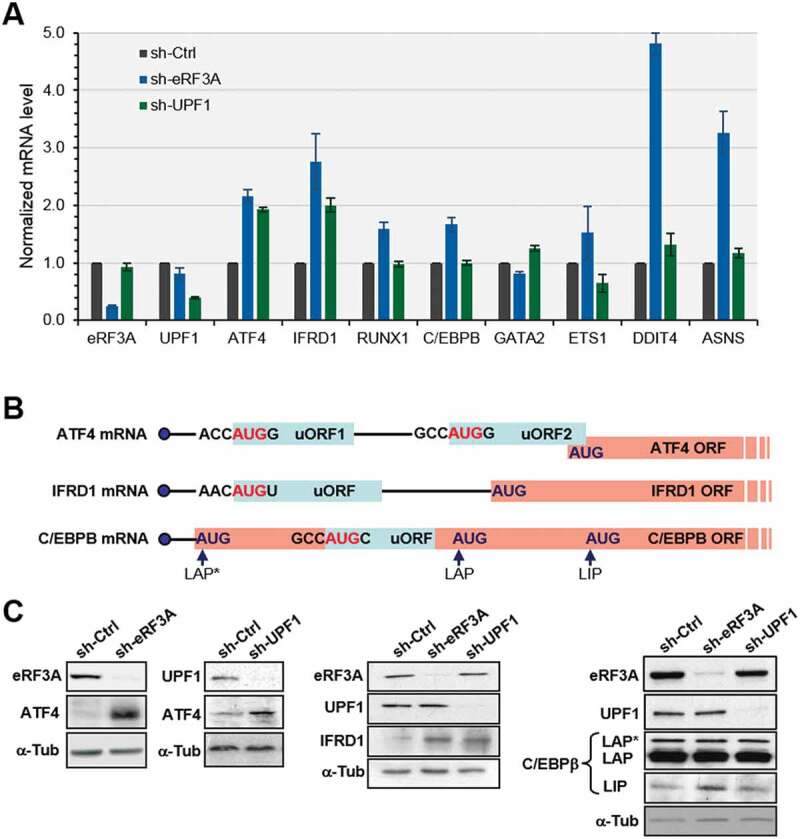
Validation of differentially expressed genes in eRF3A and UPF1 knockdown cells. (A) RT-qPCR performed on total RNA of HCT 116 cells 3 days after electroporation with shRNAs targeting eRF3A mRNA (sh-eRF3A) or UPF1 mRNA (sh-UPF1) or control shRNA (sh-Ctrl). mRNA levels of eRF3A, UPF1 and selected eRF3A and UPF1 targets are shown. The ratio of mRNA levels in either eRF3A knockdown (sh-eRF3A) or UPF1 knockdown (sh-UPF1) versus control cells (sh-Ctrl) was calculated, mRNA levels in the control cells was set to 1.0. Bars and error bars correspond to mean values and standard deviations from two independent experiments. (B) Schematic illustration of the organization of uORFs in the transcripts of ATF4, IFRD1 and C/EBPβ. The start codon context of the uORFs is indicated. ATF4 mRNA carries two uORFs with uORF2 overlapping ATF4 main ORF, IFRD1 mRNA presents only one uORF and C/EBPβ mRNA present a single uORF located within its main ORF. The different isoforms of C/EBPβ termed LAP* for liver-activating protein*, LAP and LIP for liver inhibitory protein are translated from three consecutive in-frame AUG codons[86]. (C) Western blot analysis of eRF3A, UPF1 and ATF4 (left panels), IFRD1 (central panel), or C/EBPβ proteins (right panel) in control cells (sh-Ctrl), eRF3A-depleted cells (sh-eRF3A) and UPF1-depleted cells (sh-UPF1); α-Tubulin (α-Tub) served as a loading control.
