Figure 4.

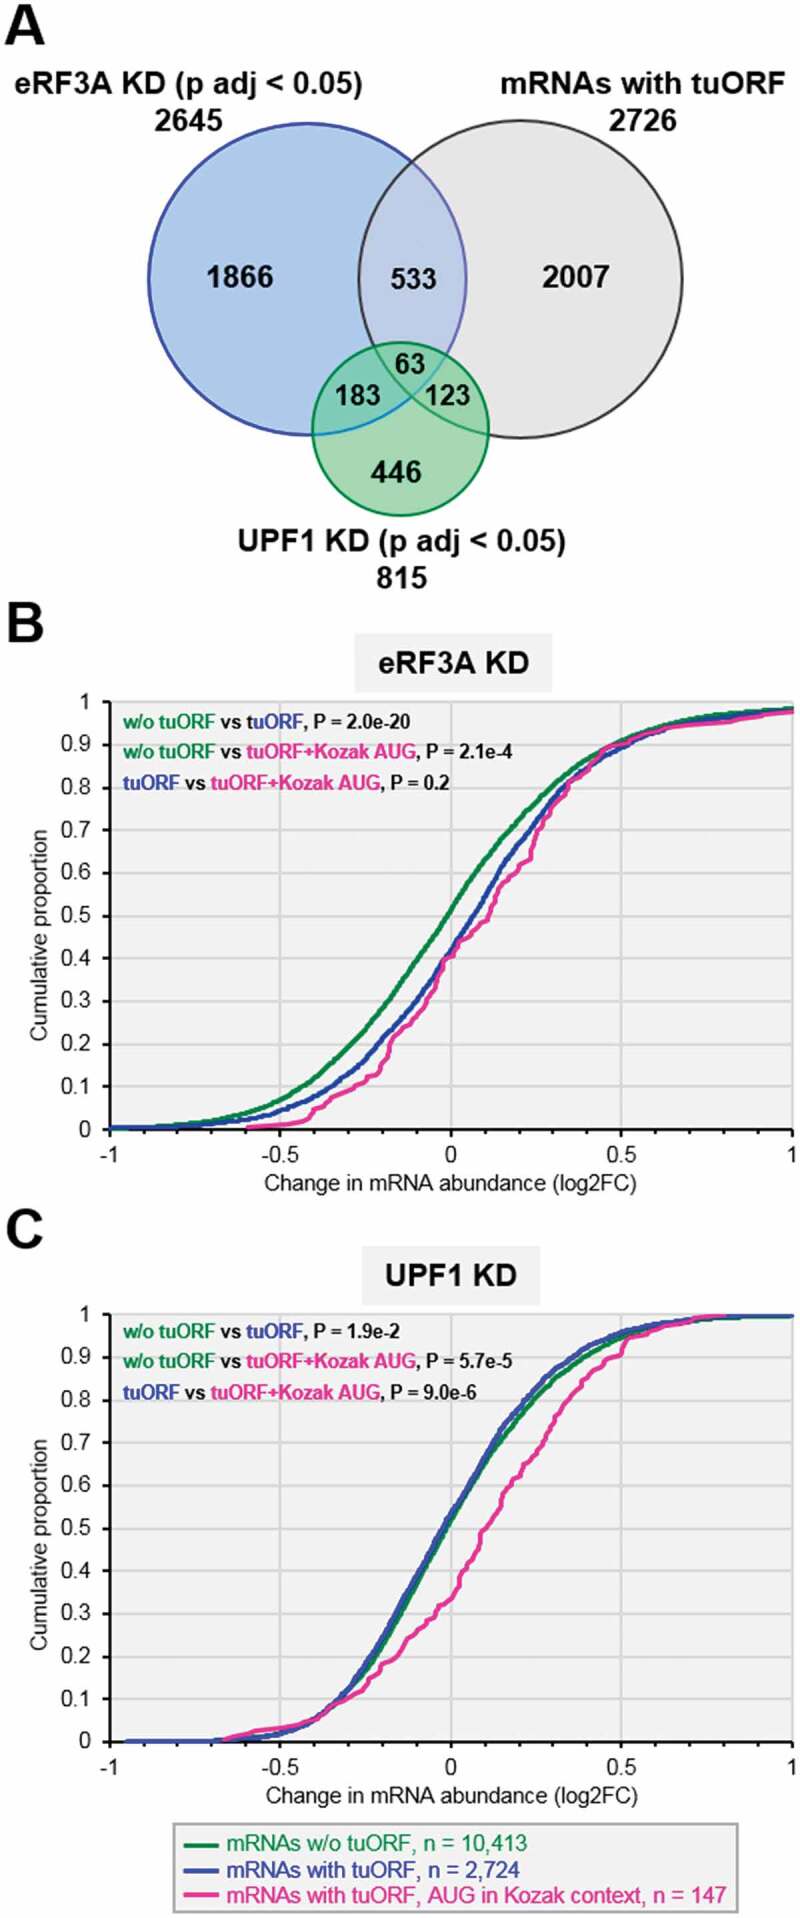
Expression of uORF carrying mRNAs in eRF3A and UPF1 knockdown cells. A. Proportional Venn diagram showing the overlap between three sets of transcripts: differentially expressed genes (main coding sequence changes in Ribo-seq data; p adj < 0.05) in eRF3A knockdown cells (blue circle, eRF3A KD), UPF1 knockdown cells (green circle, UPF1 KD) and mRNAs carrying translated uORFs – tuORF (purple circle). The number of genes is indicated for each class of mRNA. (B and C) Cumulative distribution functions of changes in mRNA abundance (plotted as log2FC) following eRF3A depletion (B, eRF3A KD) or UPF1 depletion (C, UPF1 KD) for mRNAs without translated uORF corresponding to mRNA devoid of uORF and to mRNAs with non-translated uORFs (w/o tuORF, green line), mRNAs with translated uORFs (tuORF, blue line) and mRNAs carrying a translated uORF with an AUG initiation codon surrounded by a Kozak context (pink line). In B and C, P-values were determined by Wilcoxon rank sum test for the two sided hypothesis with a 95% confidence interval. The number of genes in each category is indicated below the graphs.
