Figure 5.

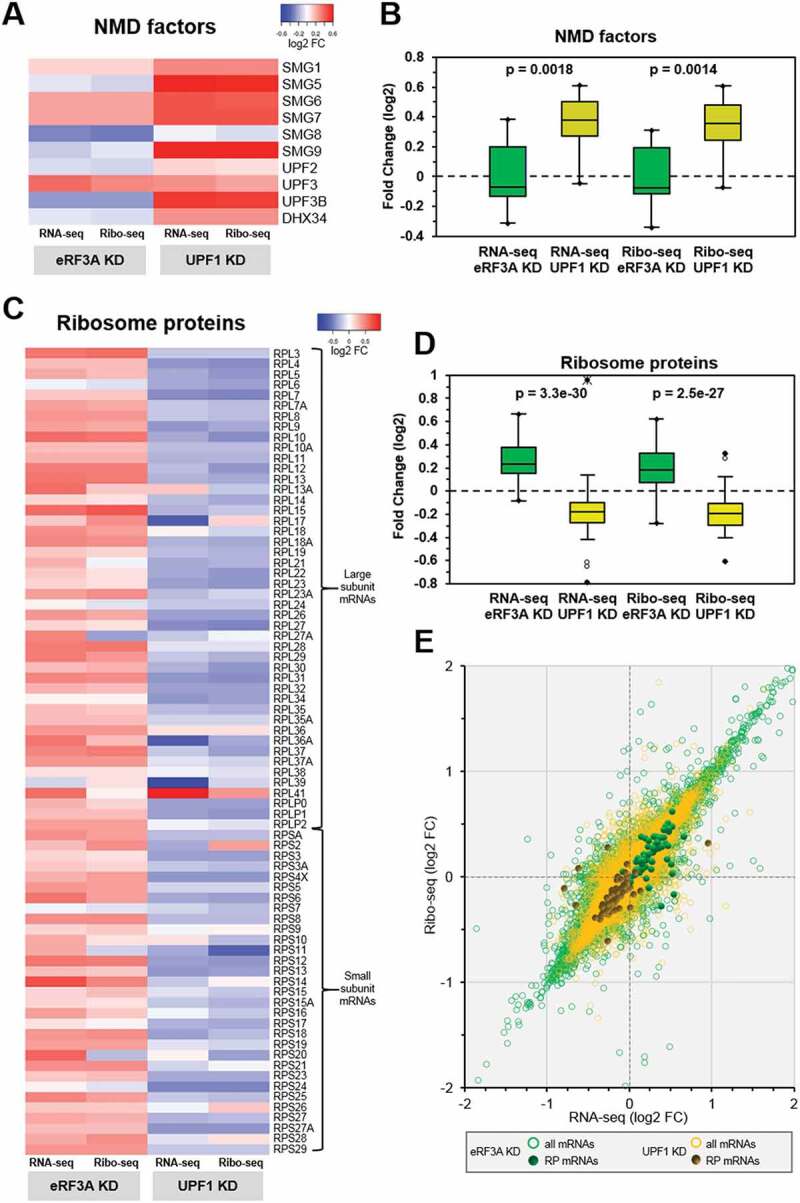
Feedback control loops in eRF3A and UPF1 knockdown cells. (A) Heatmap representation of the differential expression levels (log2 FC scale) of the NMD factor mRNAs in the transcriptome (RNA-seq) and translatome (Ribo-seq) following eRF3A knockdown (eRF3A KD) or UPF1 knockdown (UPF1 KD). Heatmap was performed using Heatmapper website http://www2.heatmapper.ca/expression/[85] without linkage clustering method. (B) Corresponding box plot of log2FC values for NMD factor mRNAs in RNA-seq and Ribo-seq experiments. The central lines show the medians; the box limits indicate the 25th and 75th percentiles. Two-tailed t-test was used to determine p-values. (C) Heatmap representation of the expression levels of ribosomal protein mRNAs in the transcriptome (RNA-seq) and translatome (Ribo-seq) following eRF3A knockdown (eRF3A KD) or UPF1 knockdown (UPF1 KD). Heatmap was performed as in A. (D) Corresponding box plot of log2FC values for ribosomal protein mRNAs in RNA-seq and Ribo-seq experiments. Box plot was performed as in B. (E) Scatter plot of the Ribo-seq versus RNA-seq differential expression for eRF3A depletion (all mRNAs: green circles and ribosome protein (RP) mRNAs: green dots) and UPF1 depletion (all mRNAs: yellow circles and ribosome protein (RP) mRNAs: dark yellow dots).
