Figure 4.

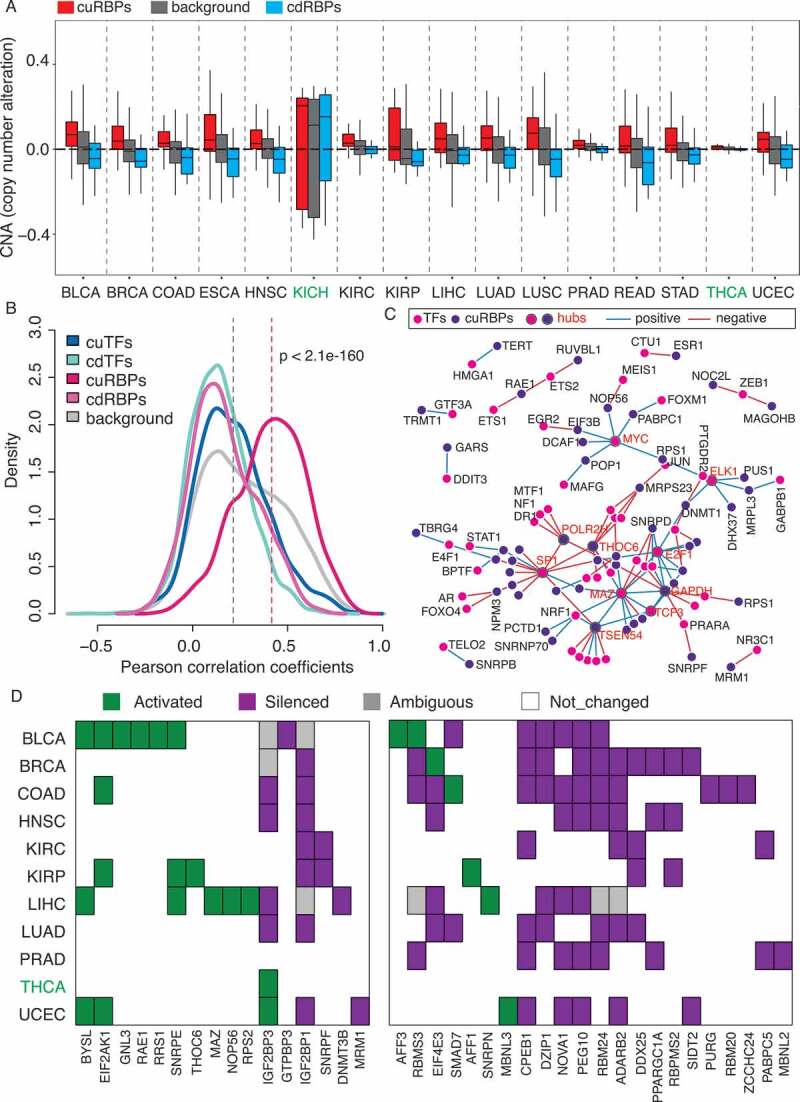
Cis- and trans-regulatory mechanisms underlying dysregulation of cuRBPs and cdRBPs across cancers. (A) The SCNA distribution of the cuRBPs, cdRBPs and background (all PCGs) across 16 cancer types in TCGA. The black horizontal-dashed line indicates the median of the SCNA of all PCGs across 16 types. (B) Density distribution of Pearson correlation coefficient between SCNA and gene expression for different gene groups. The p value represents the significance between cuRBPs and background. (C) regulatory network between TFs and their potential target cuRBPs (see Material and Methods). Hub TFs and cuRBPs were marked with grey boundary. (D) Epigenetically activated, silenced, ambiguous and no changed cuRBPs and cdRBPs genes across 11 types. Left panel are the 16 cuRBPs and right panel are 22 cdRBPs.
