Figure 4.

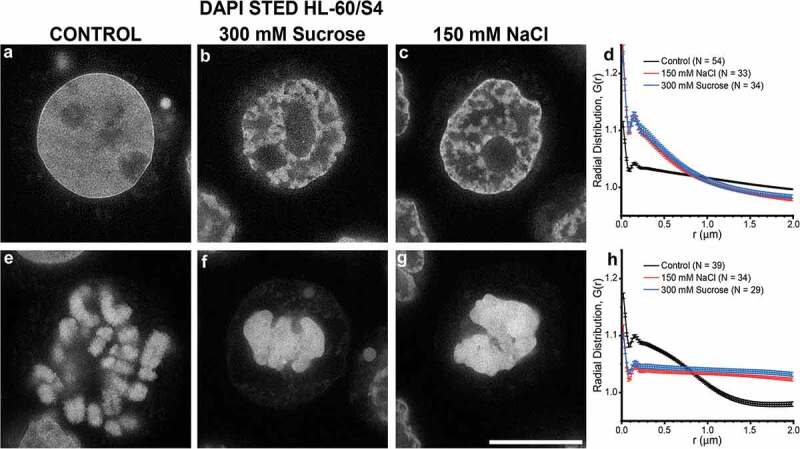
High resolution STED microscopy of HL-60/S4 cells incubated in the absence (a,e)/presence (b,f) of 300 mM sucrose or (c,g) 150 mM NaCl, stained only with DAPI. (a,b,c), interphase nuclei; (e,f,g), mitotic chromosomes. (a,e), Control (0 mM sucrose); (b,f) 300 mM sucrose; (c,g), 150 mM NaCl. DAPI staining is shown in an inverse gray scale, where ‘white’ is the most intense DAPI staining. Note the ‘sharpness’ of rim (‘epichromatin’) staining by DAPI on the Control interphase nucleus (a). Magnification bar, 10 µm. (d,h), graphs of the Radial Distribution function (density-density pair correlation) ‘G(r)’ for DAPI staining of interphase nuclei (a,b,c) or mitotic chromosomes (e,f,g). G(r) values > 1 indicate that the ‘density’ signal is greater than expected for a uniform randomly distributed signal; G(r) values < 1, signal less than uniform. N, the number of nuclei (or congealed chromosome clusters) measured for each profile.
