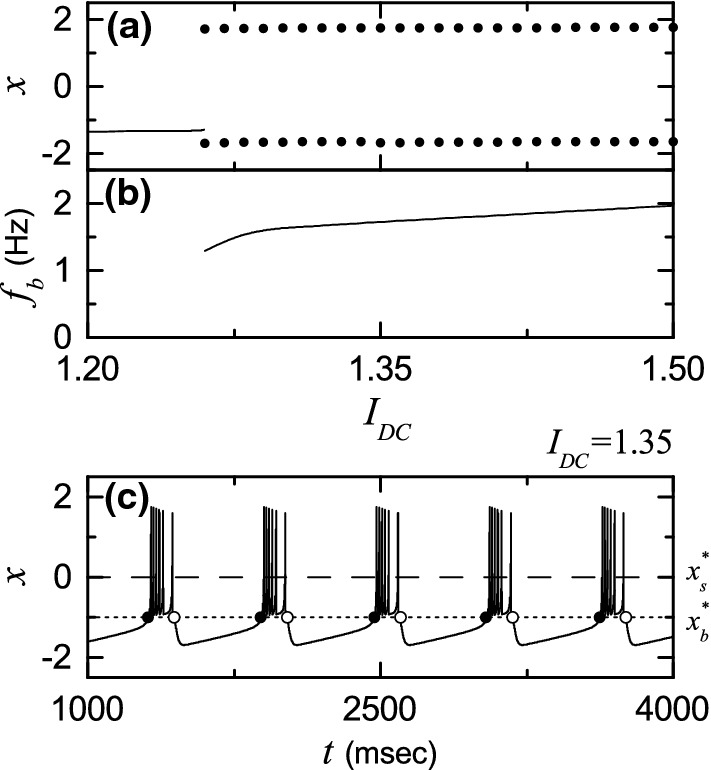
Fig. 1.

Single bursting HR neuron for . a Bifurcation diagram in the single HR neuron. Solid line represents a stable resting state, while for the bursting state, maximum and minimum values of the membrane potential x are denoted by solid circles. b Bursting frequency versus . c Time series of x(t) for the bursting state when . The dotted horizontal line () and the dashed horizontal line () denote the bursting and the spiking thresholds, respectively. The solid and open circles represent the burst onset and offset times, respectively
