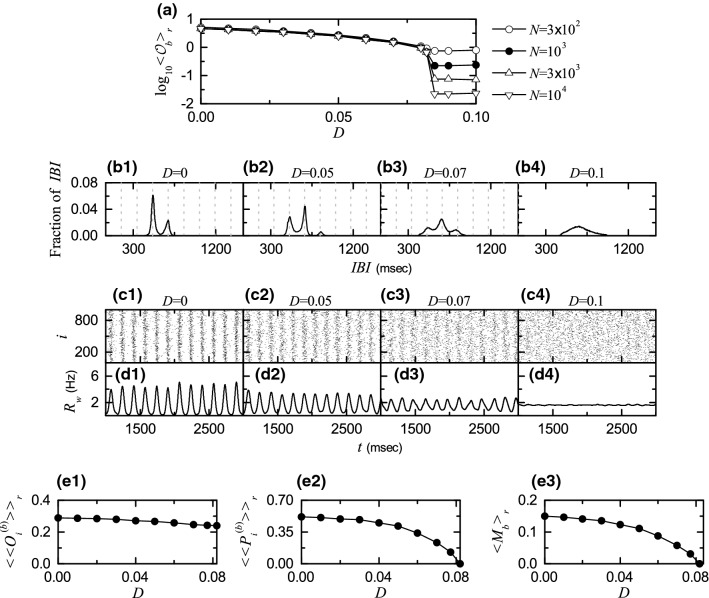
Fig. 11.
Noise effect in the 3rd route for . a Plots of thermodynamic bursting order parameter versus the noise intensity D. IBI histograms for b1 0, b2 0.05, b3 0.07, and b4 0.1. Vertical dotted lines in (b1–b3) represent integer multiples of the global period of . Raster plots of burst onset times in the whole population when c1 0, c2 0.05, c3 0.07, and c4 0.1. IWPBR kernel estimates of the whole population for d1 0, d2 0.05, d3 0.07, and d4 0.1. Plots of e1 the average occupation degree , e2 the average pacing degree , and e3 the statistical-mechanical bursting measure versus D

