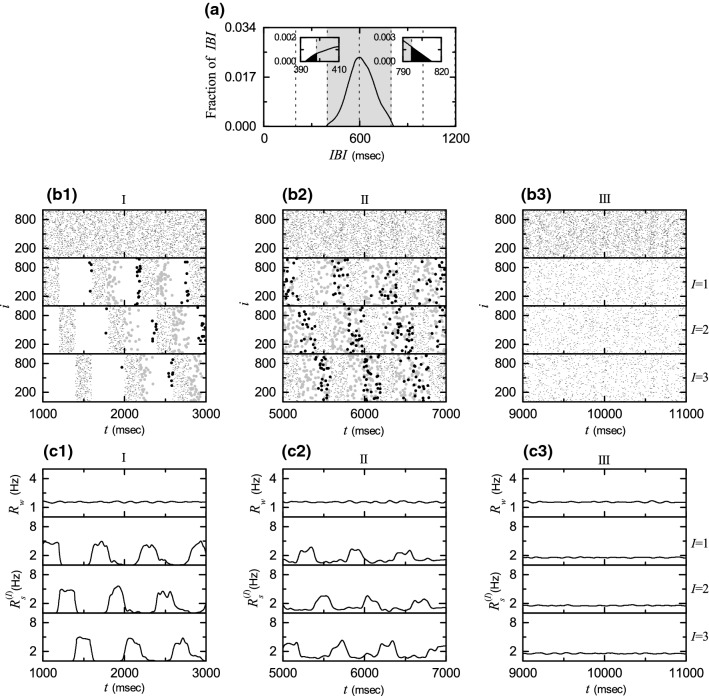
Fig. 3.
Break-up of 3-cluster state via intercluster hoppings for . a IBI histogram. Delocalization of IBIs through crossing the left and the right vertical boundary lines of the gray region (corresponding to and respectively). Sequential long-term raster plots of burst onset times in the whole population and in the Ith cluster ( and 3) in b1 the early, b2 the intermediate, and b3 the final stages; in (b1, b2), late burstings with IBIs larger than and early burstings with IBI smaller than are plotted with gray and black dots of a little larger point size. IWPBR of the whole population and ISPBR of the Ith cluster (1, 2, and 3) in the c1 early, c2 the intermediate, and c3 the final stages

