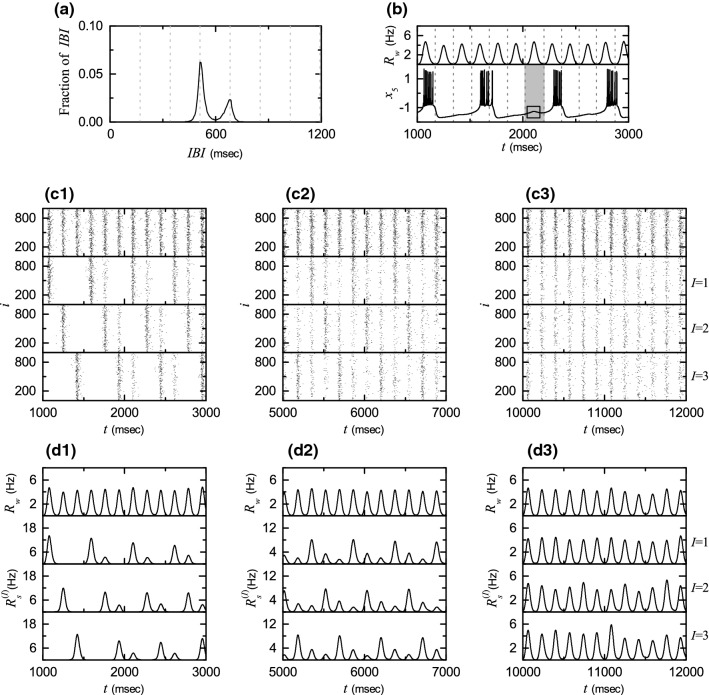
Fig. 5.
Break-up of 3 clusters via intercluster hoppings for . a Double-peaked IBI histogram. Vertical dotted lines denote integer multiples of the global period msec) of . b Time series of membrane potential for the 5th HR neuron in the 1st () cluster. For reference, the IWPBR of the whole population is shown in the top panel. The 5th HR neuron exhibits a bursting at the 4th cycle of rather than at its 3rd cycle where it shows a hopping instead of bursting, as shown inside the small box in the gray region (corresponding to the 3rd cycle). Sequential long-term raster plots of burst onset times in the whole population and in the Ith cluster (1, 2, and 3) in c1 the early, c2 the intermediate, and c3 the final stages. IWPBR of the whole population and ISPBR of the Ith cluster (1, 2, and 3) in the d1 early, d2 the intermediate, and d3 the final stages

