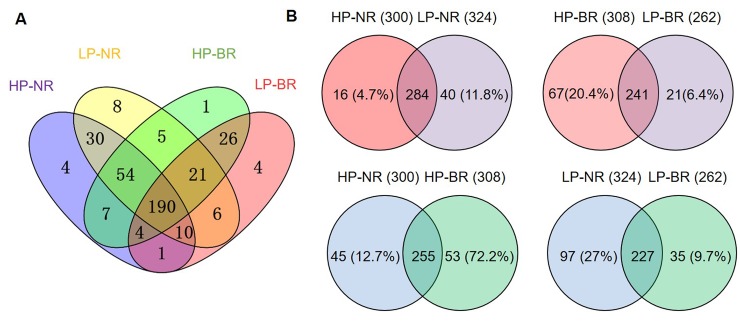
Fig 2. Comparison of soybean circRNAs in each sample under different P levels.
(A) Venn diagrams of circRNAs identified in the four samples, including the roots of two representative soybean genotypes under different P levels. (B) Venn diagrams comparing expressed circRNAs in each root sample under different P levels.

