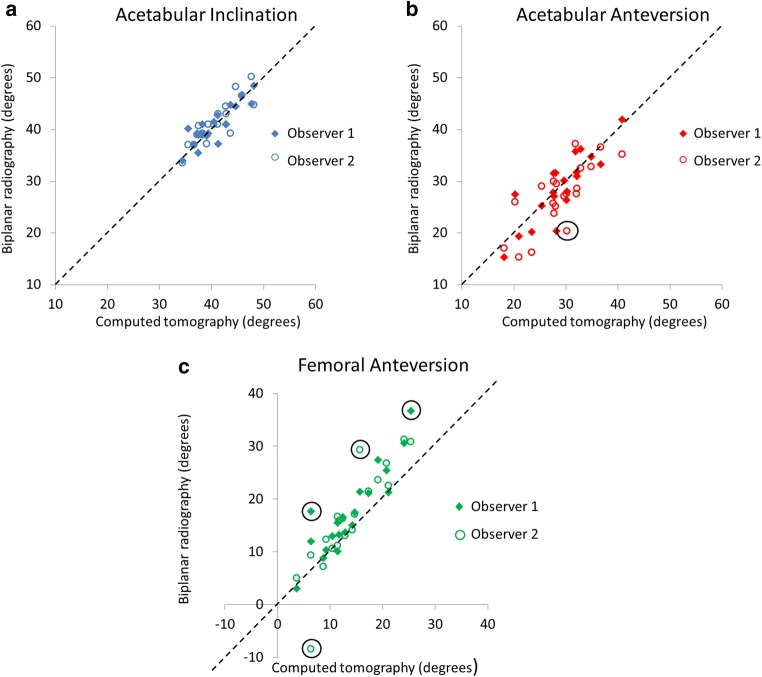
Fig. 4.
Scatter plots showing computed tomography (CT) and biplanar radiography measurements for cup inclination (a), cup anteversion (b), and femoral anteversion (c) in the same 20 patients. If CT and biplanar radiography measurements are a perfect match for a patient, a data point falls on the dotted black line. Black circles identify data points where biplanar radiography measurements differed from CT measurements by more than 10°.

