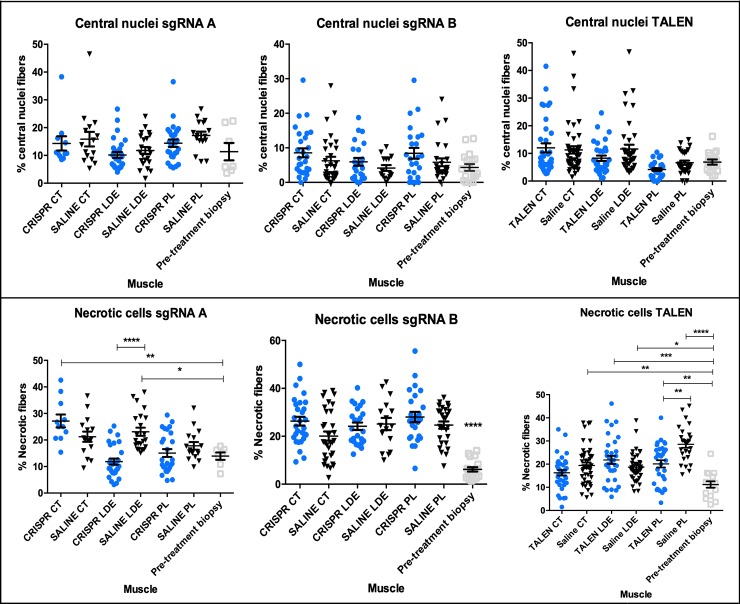
Fig 7. Percentage of central nuclei and necrosis from all three HDR treatments.
Top: centrally nucleated fibers expressed as a percentage of fibers for every group treatment, sgRNA A, B and TALEN. Bottom: percentage of necrotic fibers for every treatment, sgRNA A, B (all significant versus pre-treatment biopsy) and TALEN. Blue circles denote HDR-injected limb while black triangle denotes saline-injected limb. Pre-treatment biopsy is indicated in grey square. Analysis was performed with One-way ANOVA multiple comparisons test. *p<0.05; **p< 0.01.; p***<0.001; p****<0.0001; CT = cranial tibial; LDE = long digital extensor; PL = peroneus longus.

