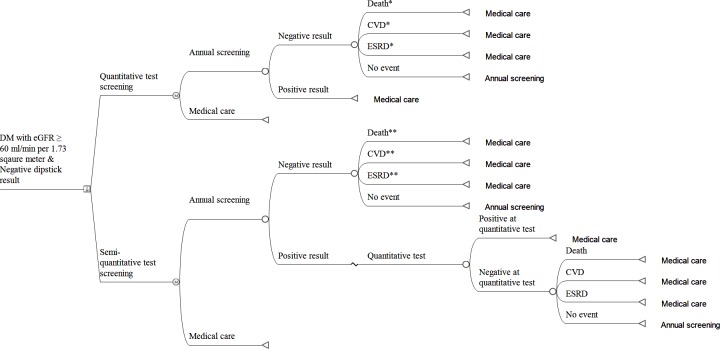
Fig 1. Structure of the Markov model.
The square denotes a decision node where the quantitative or semi-quantitative screening strategy can be chosen. The circles represent chance nodes in which subsequent events occur at probabilities allocated to each node. The letter M in a circle indicates a Markov node. The triangles represent terminal nodes, where subjects return to the Markov node from which they started the cycle and start the next cycle again. Descriptions accompanying terminal nodes designate the path for the subjects to follow at the next Markov cycle. * Annual probabilities of these clinical events were derived from diabetic patients with normo-albuminuria. ** Putatively, both true negative and false negative fractions are present in the SemiQ negative population. The occurrences from both cases were included. For the population with false negatives, the hazard ratio for clinical outcomes was assessed in micro- or overt albuminuric diabetic patients. Additionally, for the population with true negative results, the hazard ratio for clinical outcomes was assessed in normo-albuminuric diabetic patients. Abbreviations: CVD, cardiovascular disease; DM, diabetes mellitus; ESRD, end-stage renal disease.

