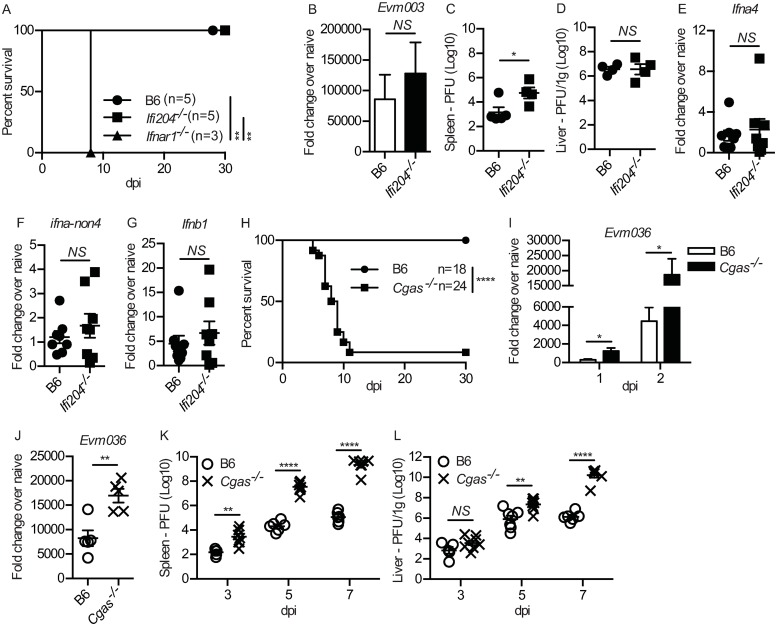
Fig 1. cGAS, but not IFI204, is required for optimal resistance to ECTV infection.
(A) Survival of the indicated mice. (B) Expression of Evm036 in the dLN at 2 dpi of the indicated mice as determined by RT-qPCR. Data are displayed as mean ± SEM from 5 mice per group in one experiment, which is representative of two similar experiments. (C-D) Virus loads in the spleen (C) and liver (D) of the indicated mice at 7 dpi as determined by plaque assay. Data are displayed as the mean ± SEM of 4–5 mice per group. (E-G) Expression of IFN-I in the dLN at 2.5 dpi of the indicated mice as determined by RT-qPCR. Data are displayed as mean ± SEM from 5 mice per group in one experiment, which is representative of three similar experiments. (H) Survival of the indicated mice. (I-J) Expression of Evm036 in the skin (1 or 2 dpi) (I) and dLN (2 dpi) (J) of the indicated mice as determined by RT-qPCR. Data are displayed as mean ± SEM from 5 mice per group in one experiment, which is representative of three similar experiments. (K-L) Virus loads in the spleen (K) and liver (L) of the indicated mice at 3, 5 or 7 dpi as determined by plaque assay. Data are displayed as the mean ± SEM of 5–6 mice per group. For all, *p<0.05, **p<0.01, ***p<0.001, ****p<0.0001.

