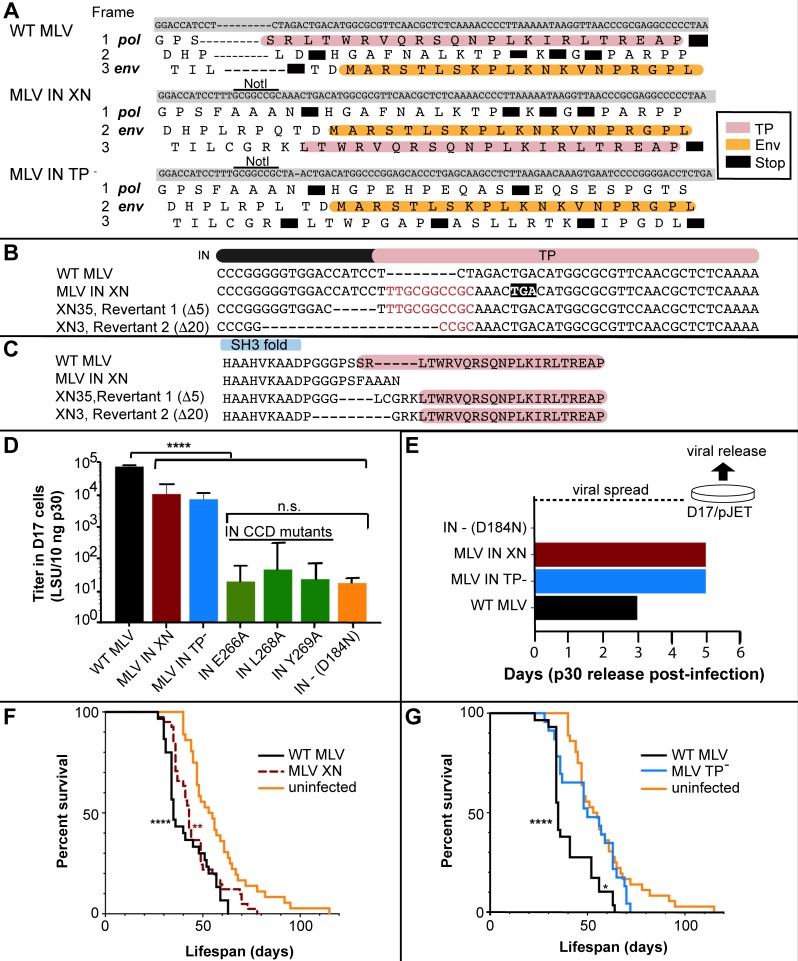
Fig 1. MLV IN TP- constructs and viral characteristics in cell culture and in the MYC/ Runx2 mouse model.
(A) Alignment of the three MLV IN constructs, WT MLV, MLV IN-XN and MLV IN TP- in the overlap region of the IN TP (pink) and Env (orange) reading frames. Black boxes represent stop codons. (B) Viral revertants identified in MYC/Runx2 tumors infected with MLV IN-XN. The different pol sequences are aligned with regions corresponding to the IN (black bar) and TP (pink). NotI linker insertion [40] that generated IN-XN is indicated in red. Deletions (Δ5 and Δ20) with respect to IN-XN are indicated by dash lines. The premature TGA stop codon in IN-XN is shown by black box. (C) Protein alignment of WT MLV, MLV IN-XN and IN revertants. Deletions were localized between the SH3 fold (blue) and the TP (pink) of IN. (D) LacZ titers (LSU, lacZ staining units) of the various IN mutant constructs: WT MLV (black), MLV IN-XN (dark red), MLV IN-TP- (blue), IN CCD mutants (green), and IN—D184N (orange). Dunnett’s Multiple comparison test: ****P<0.0001, n.s = no significance. Error bars indicate SEM; n = 3. (E) Viral spread of MLV IN mutants and WT MLV in D17/pJET cells measured by p30 (CA) released into media. Proviral DNA was transiently introduced into cells using DEAE dextran. Viral supernatants were collected at the indicated days and levels of CA were detected by ELISA [86]. (F) Survival curves of MYC/Runx2 mice infected neonatally with MLV IN-XN. WT MLV (solid black) or MLV IN-XN (dashed brown); the solid orange line is for non-infected control (NC) animals. Log-rank test survival curve comparisons: MLV WT (n = 30) vs. MLV IN-XN (n = 40) P = 0.09; MLV WT vs. uninfected (n = 36), ***P<0.0001; MLV IN-XN vs. uninfected, **P≤0.002 (G) Survival curves of MYC/Runx2 mice infected neonatally with MLV IN TP-. WT MLV (black) or MLV IN TP- (blue); orange is same as in panel F. Log-rank test survival curve comparisons: MLV WT (n = 29) vs. uninfected (n = 36); ****P<0.0001; MLV WT vs. MLV IN TP- (n = 23), *P = 0.006; MLV IN TP- vs. uninfected, P = 0.26.

