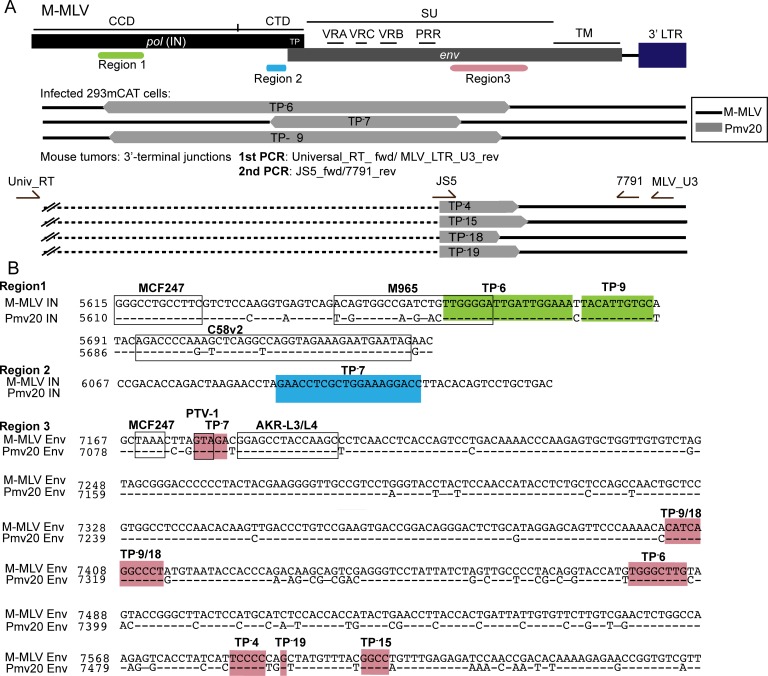
Fig 3. Recombinants in MLV IN TP-16 tumors and 293mCAT cells infected with tumor derived viruses.
(A) Diagram of the breakpoints of the recombinants in pol and env regions. The three regions where breakpoints were localized are indicated; region 1 (green), region 2 (blue) and region 3 (salmon). Recombinants isolated from mouse tumors and infected 293mCAT cells are grouped as indicated. Segments with homology to Pmv20 are indicated in grey and M-MLV is indicated in black. For infected 293mCAT cells, primers used to identify the recombinants are in S2 Fig. For recombinants identified in tumors, the nested PCR primers used to identify the 3’ breakpoints are shown in the diagram. The dashed black line indicates undetermined 5’ junction point for those revertants. (B) The breakpoints of recombinants on the alignment of the M-MLV and Pmv20 are shown and arranged by region. Previously reported recombinants [46] are indicated in black boxes in region 1 and region 3 (PTV-1). Coloring of the three regions are as indicated in panel 3A. Crossover regions within individual tumors are labeled.

