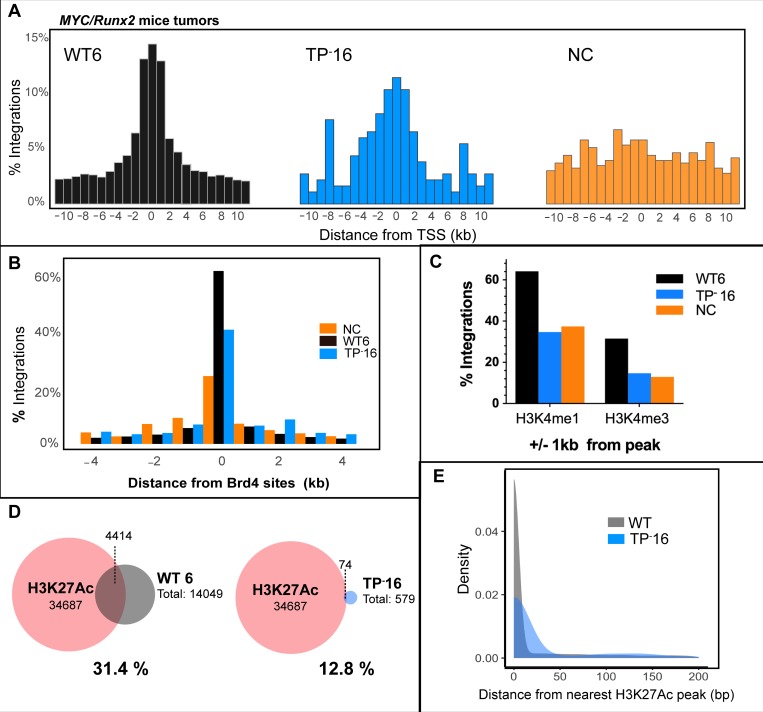
Fig 4. Comparison of MLV integration profiles of tumors from IN TP-16 and WT6 mice.
In all panels, the IN TP-16 integrants are indicated in blue, WT6 in black/grey, and non-infected control (NC) in orange. (A) Histograms of MLV integration profile with respect to TSSs. (B) Association of RIS with Brd4 binding regions (annotated from GSM1262345). (C) The percentage of RISs that overlap within +/- 1 kB from peaks of histone marks H3K4me1 and H3K4me3. (D) Venn diagram of overlap of H3K27Ac peaks (ENCFF974HMO) with RISs. The dash lines indicate the number of RISs overlapping with H3K27Ac. (E) Density plot of RISs from nearest H3K27Ac peaks. The average WT RISs from all tumor samples (grey) is plotted against TP-16 (blue).

