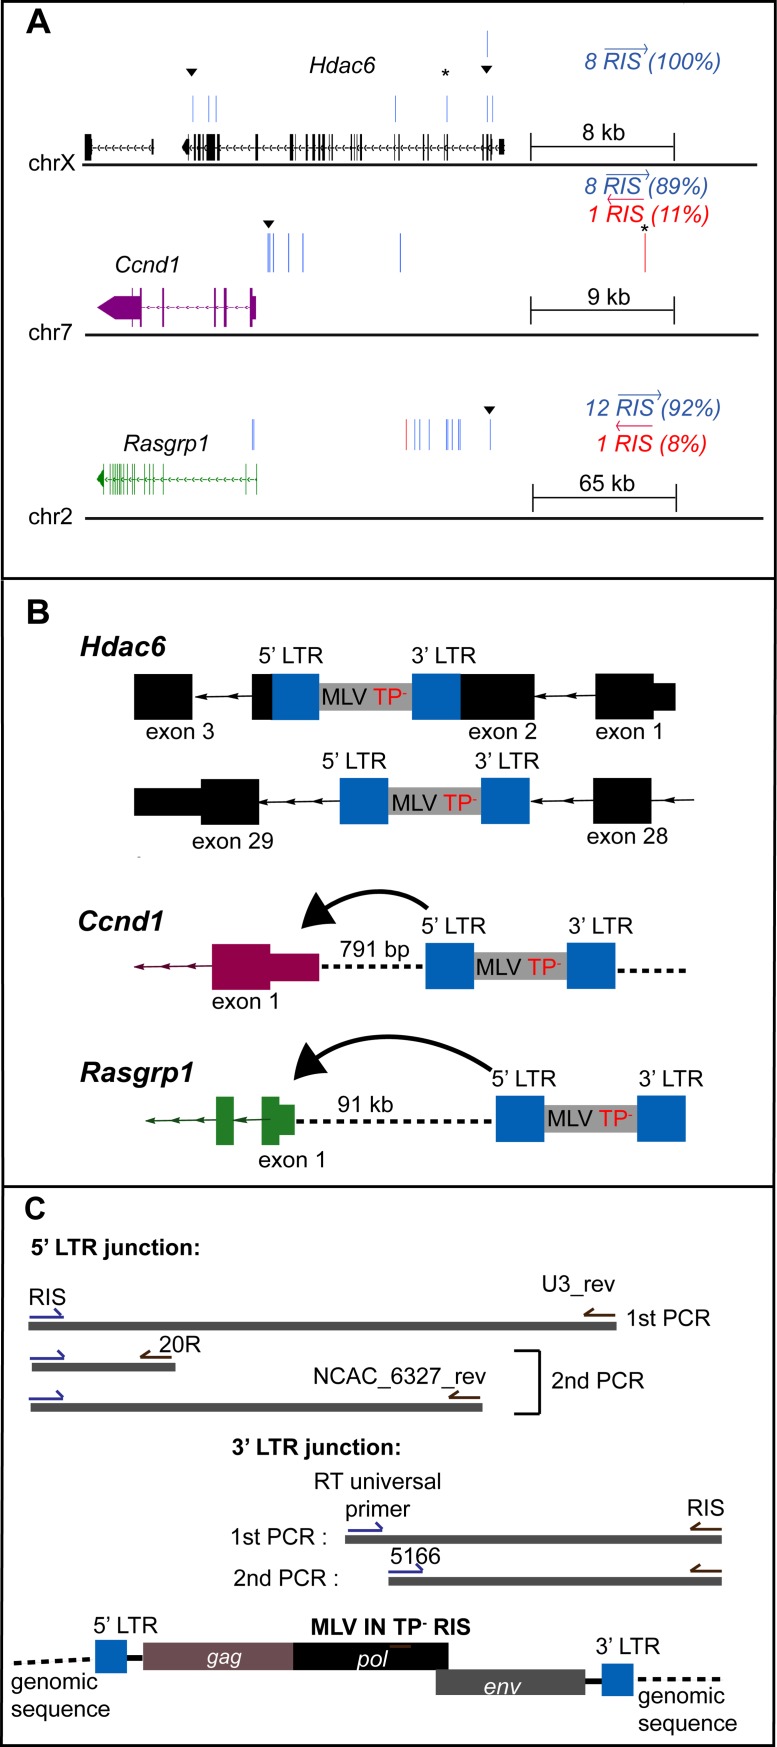
Fig 5. Analysis of the top targeted integration sites within the IN TP-16 tumor.
(A) Orientation bias of RIS in three CIS genes: Hdac6 (black), Ccnd1 (purple), Rasgrp1 (green). The exons and introns are represented in boxes and lines with arrow that show strand orientation respectively. RIS is represented by a vertical bar and differentially colored based on orientation (blue forward, red reverse) relative to the plus-strand DNA. Gene structures are derived from Integrated Genome Browser (mm10). (▼) denotes the top copy number RIS analyzed. (B) Diagram of the TP-16 RISs relative to the closest CIS gene. The integrated MLV is depicted in grey, with LTR indicated in blue. Coding regions of CIS are represented as in panel A. Intergenic regions are represented in dashed lines. Direction and distance between 5’ LTR and TSS are indicated. IN regions verified to maintain the TP- phenotype are indicated. (C) Schematic diagram of the nested PCR utilized to isolate the RIS from mouse tumor DNA. Primers used in the first and second round PCRs for the 5’ and 3' LTR junction points of RISs are included in the diagram. Sequences of all oligonucleotides are described in Table in S2 Table.

