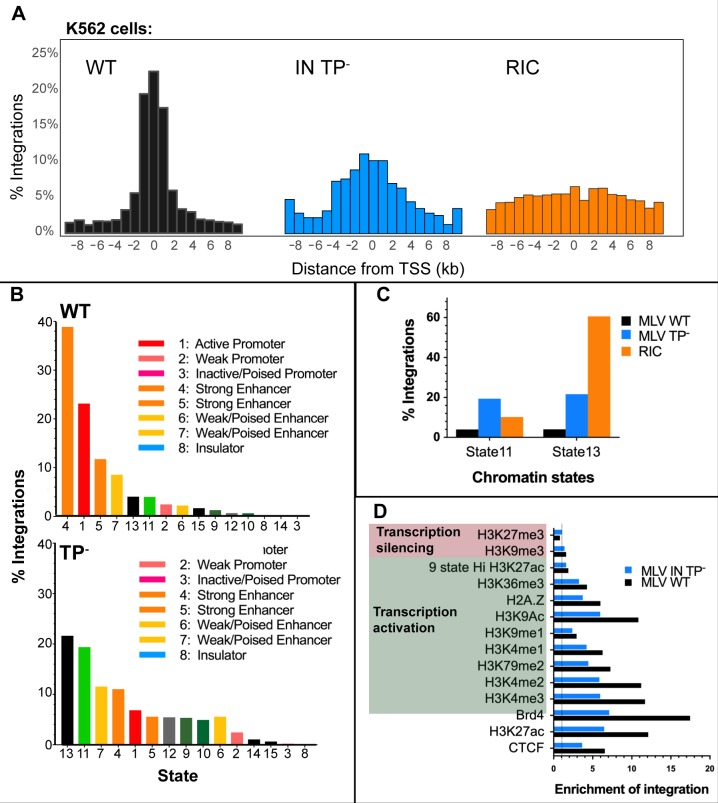
Fig 6. Analysis of IN TP- and WT MLV integration sites in K562 cells.
(A) Histograms of MLV integration profile with respect to TSSs. (B) Percentage of RISs in 15-chromatin states [55] in K562 cells: WT (top panel) and IN TP- (bottom panel). Each chromatin state is labeled with corresponding color as indicated. (C) Percentage of RISs in state 11 and state 13 compared to RIC. State 11 is described as weakly transcribed regions and state 13 are heterochromatin regions [55]. (D) Enrichment of integrations in ChipSeq peaks of different histone marks and Brd4 binding regions in K562 cells. Value of enrichment is calculated by dividing the number of RISs with RIC values at each histone mark. The dotted line is the level of enrichment expected by chance. Transcription silencing histone marks are in pink and transcription activating marks are in green.

