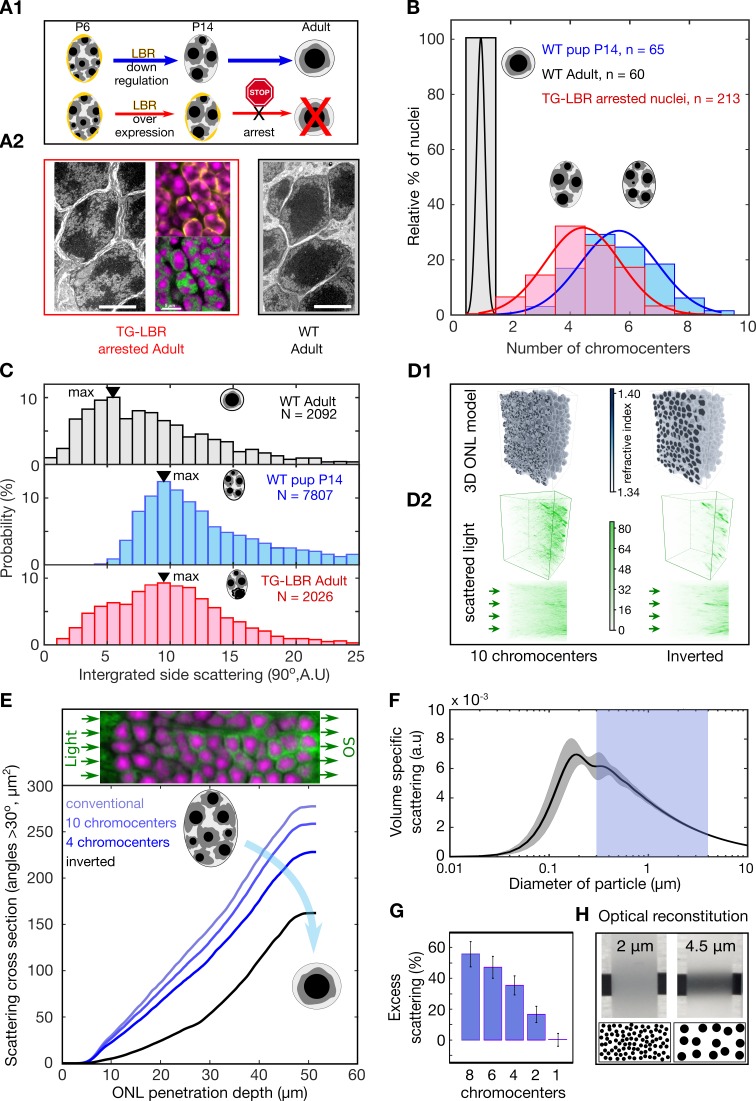
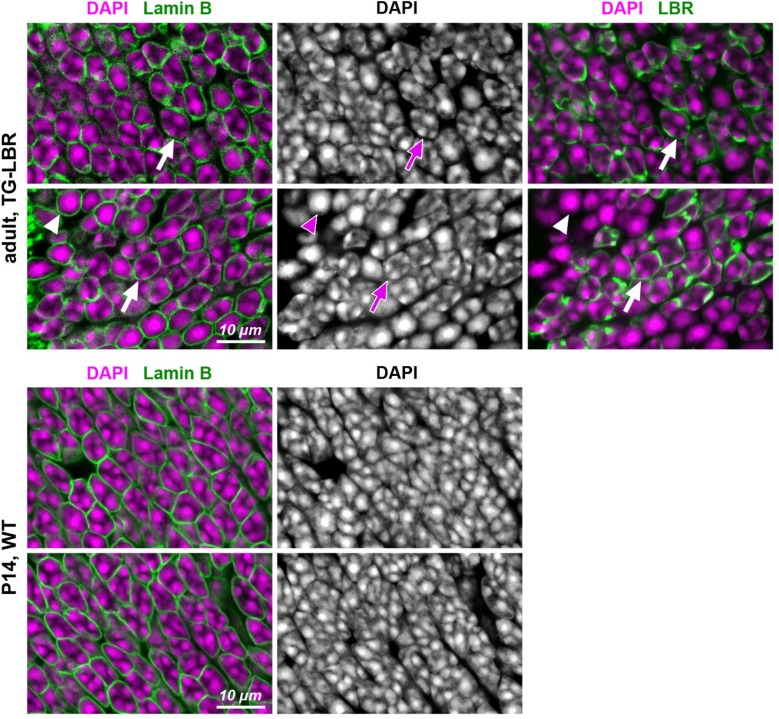
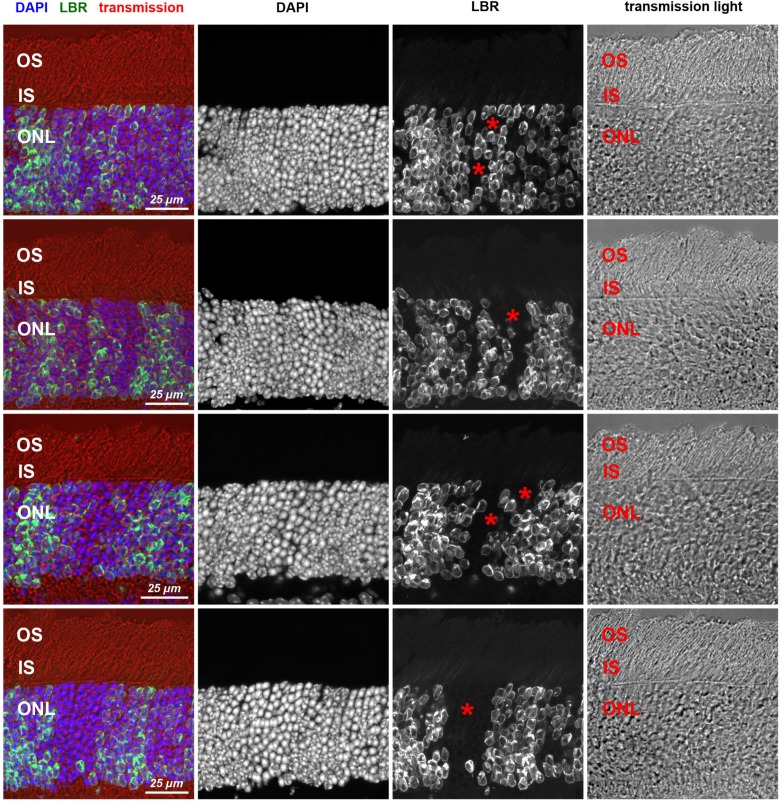
Figure 2. Developmental arrest of chromocenter fusion increases light scattering from rod nuclei in measurements and tissue simulations.
(A1) Schematic of the normal rod nuclear WT development and inversion arrested nuclei by LBR overexpression. (A2) EM images illustrating different electron densities in the euchromatic and heterochromatic phase underlying their refractive index (RI) differences (scalebar 5 μm). (mid-top) Immunostaining of overexpressed of LBR tethers (yellow), and high-density heterochromatin (DAPI, magenta). (mid- bottom) Heterochromatic chromocenters (DAPI, magenta) and euchromatin (H4K5ac, green) (B) Chromocenter number distribution in LBR overexpressing rod nuclei is drastically different from WT mice, and similar to a developing WT pup (P14). (C) Side scattering assessed by FACS for TG-LBR retina nuclei is higher than that of WT nuclei and comparable to that of a WT P14 nuclei with similar chromocenter numbers. Note the shift of peak value upon LBR overexpression. (D1) 3d RI distribution mapped onto anatomically faithful volumetric ONL images. WT inverted architecture (right, top) and early developmental state (left) (simulation). (D2) (top) Differential simulations of light propagation in the ONL, using same positions and shapes of about 1750 nuclei, but varying chromatin distributions. (bottom) Maximum projection illustrating greater proportions of scattered light (angles > 30 deg) in the ONL with multiple chromo-centered nuclei. (E) Quantitative analysis of this data. (F) Angle weighted volume-specific scattering strength for nuclei models evaluated by Mie scattering theory. (G) Excess scattering occurring in multi-chromocenter nuclei models. (H) Chromocenters scattering reconstituted in an emulsion of silica spheres in glycerol-water mixture. Pictograms reflect accurate number ratio of spheres.


