. 2019 Dec 11;8:e49542. doi: 10.7554/eLife.49542

Figure 3. Nuclear inversion improves retinal contrast transmission characteristics.

(A) Retinal contrast transmission increases during developmental stages of nuclear inversion, as experimentally revealed by measurements of retina-transmitted sinusoidal stripe patterns (modulation transfer functions). Developmental stage P12-14 (N = 18), compared to wildtype adult (N = 19 animals), note log scale. (B) These improvements in optical quality do not occur in retinae in which rod nuclei are transgenitically arrested in development and maintain 4–5 chromocenters. TG-LBR mouse (N = 18 animals) compared to WT reference (N = 19 animals), N = 1950 images in total. Mean + /- 95% CI. (C) Retinal contrast transmission at visually relevant spatial frequencies showcasing on an average ~49% and~37% better contrast transfer by the WT Adult retina (grey) in comparison to the WT-P14 pup (blue) and TG-LBR Adult (red) respectively. (D) The optical quality improvement of the retina (relative Strehl ratios), as caused by nuclear inversion, is two-fold (p=1.1880e-08 - WT adult vs WT pup, 3.4055e-08 - WT adult vs TG-LBR adult, 0.4761 - TG-LBR adult vs WT pup). (E1) Point spread function (PSF) for WT and LBR adult retinae by projection of 3 µm point light stimuli through the retina, N = 240 measurements in total six retinae. (E2) Intensity quantification along the white dotted line. Shaded region shows ±1 sd. Comparable resolution in transmitted images as assessed by the FWHM of the psf (inset). (E3) Near identical diffuse light transmission by both WT and TG-LBR retinae (n = 2 animals each, mean ± s.d.) (F) Intensity of a moving, retina-transmitted point stimuli for WT (black) and TG-LBR mouse (red). (G) Image-series of a cat approach as seen through the retina of mice, WT and transgenic genotype from various behaviorally relevant distances at the same vision limiting (arbitrarily chosen) signal to noise level. Consistent intensity differences of two or more color shades indicate significantly better predator detection potential for WT mice. Data magnified for clarity.

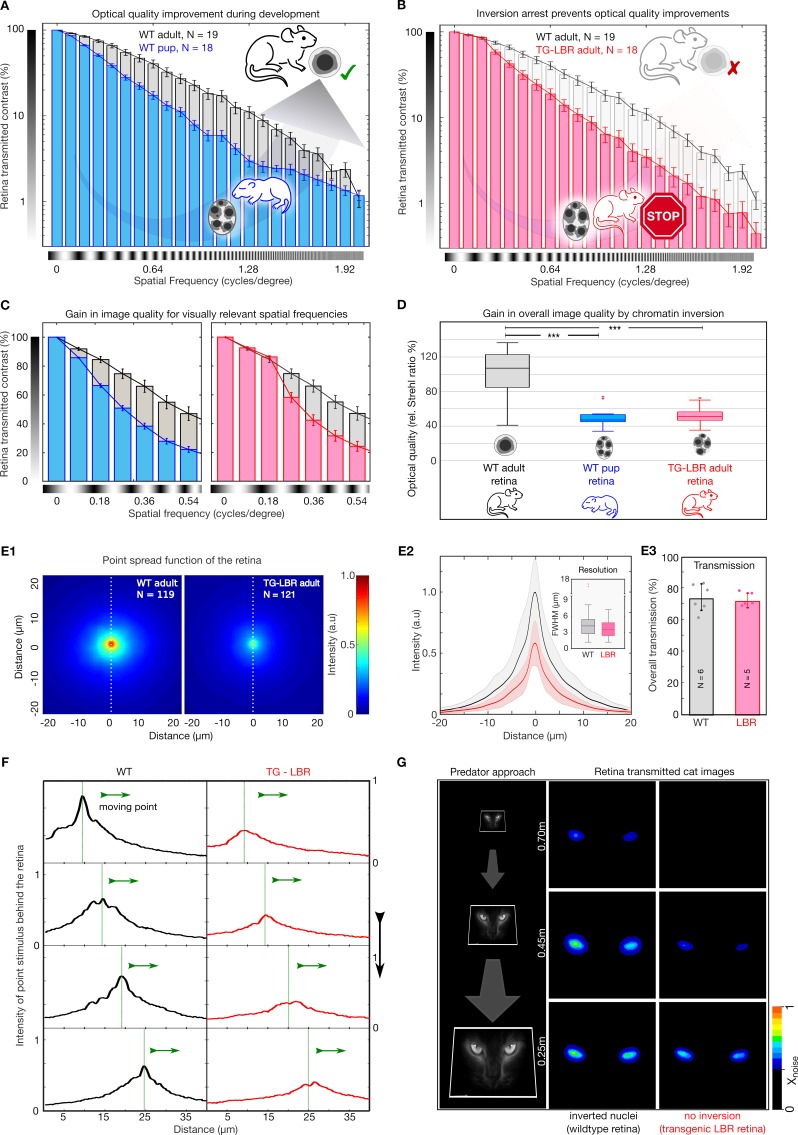
Figure 3.

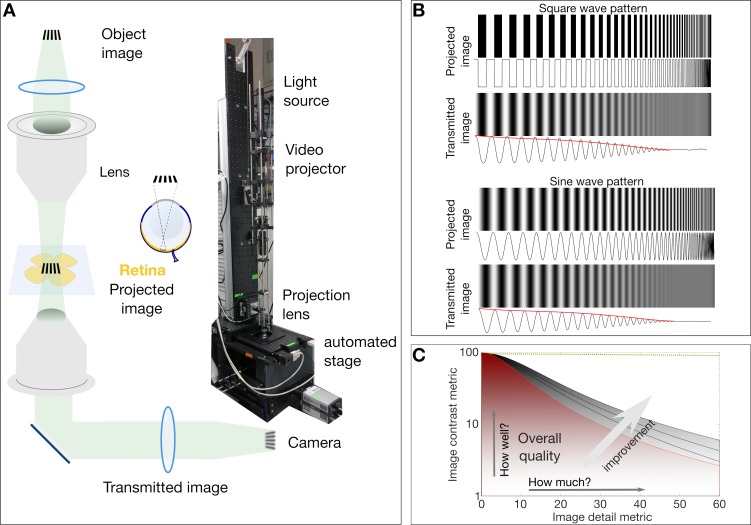
Figure 3—figure supplement 1. Simplified schematic of the custom micro-projection setup and the concept of modulation transfer function.

Figure 3—figure supplement 1.

(A) Simplified schematic and photo of the micro projection setup indicating the image object. The projecting lens functions like the biological eye (same NA = 0.45) to project the image on to the retina. The transmitted image is collected by a second lens and recorded on a camera. (B) The loss of contrast inherent to imaging systems (compare contrasts and intensity signals in projected and transmitted images). The envelope of the gradually degreasing signal (shown in red) is essentially the transfer function of the imaging system. The study of the contrast at various image details and fineness results in the MTF curves as shown in (C). (C) A typical MTF plot of image contrast vs image detail parameters. In this depicted case the overall image quality is proportional to the area under the curve that can yield the Strehl Ratio (a combined metric of how well and how much of the image is visible).
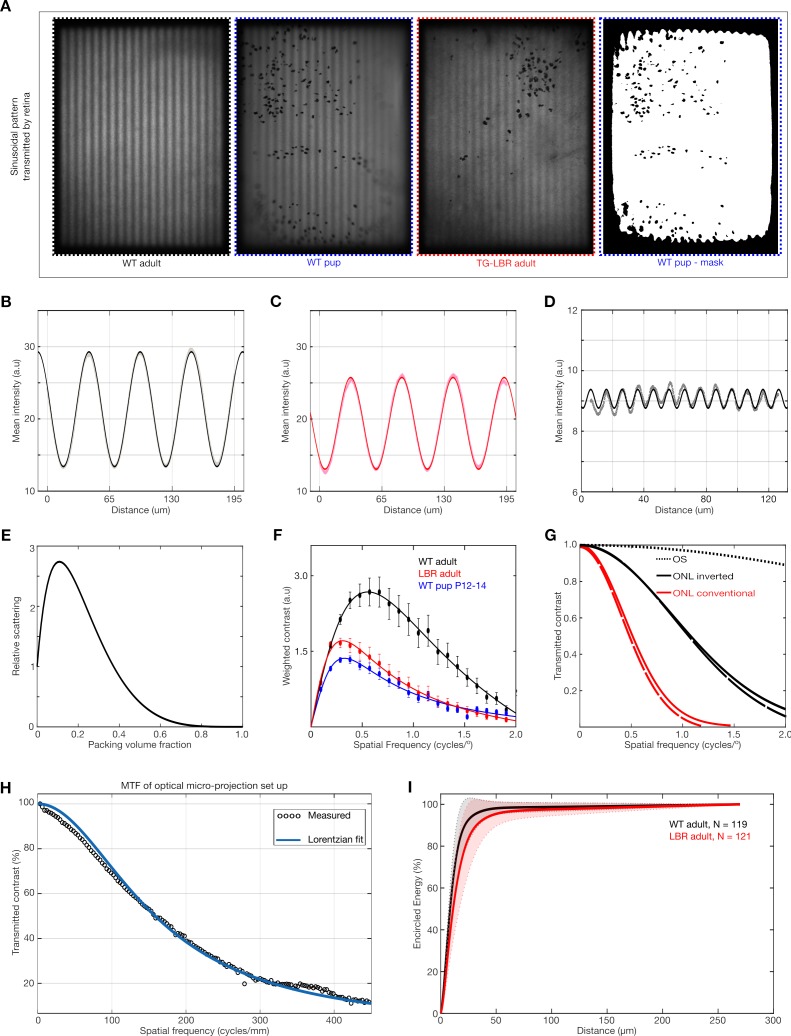
Figure 3—figure supplement 2. Modulation Transfer Function and its relation to light scattering and visual perception.

Figure 3—figure supplement 2.

(A) Representative images of sinusoidal patterns transmitted by the different retinae and a mask image (far right) illustrating the ROI used for contrast analysis. (B, C) Fitting of pure sinusoidal curves to the measured intensity in a WT and TG-LBR mouse retina at 0.1cyc/deg. The greater transmission of contrast is evident from the amplitude of the sine waves in the WT retina. (D) Illustration of robustness of the sine curve fitting for very low residual contrast (~3%) and very fine image details. (E) Dependent scattering effects due to close packing of scatterers for various volume fractions. (Calculations based on models described in literature). (F) Frequency weighted contrast transmission curves for the evaluation of the Strehl Ratio. (G) Estimates of comparison of MTF from modelling and simulation of light scattering by outer nuclear layer (ONL) and outer segments (OS) illustrating the dominant effect of the packed nuclei as opposed to the outer segments. (H) Modulation transfer function of the optical micro-projection set up. (I) Encircled energy (EE) plot. EE under the retinal PSF converges to the same value for both WT (black) and TG-LBR retinae (red) Shaded regions show standard deviation. N = 240 measurements in total six retinae.