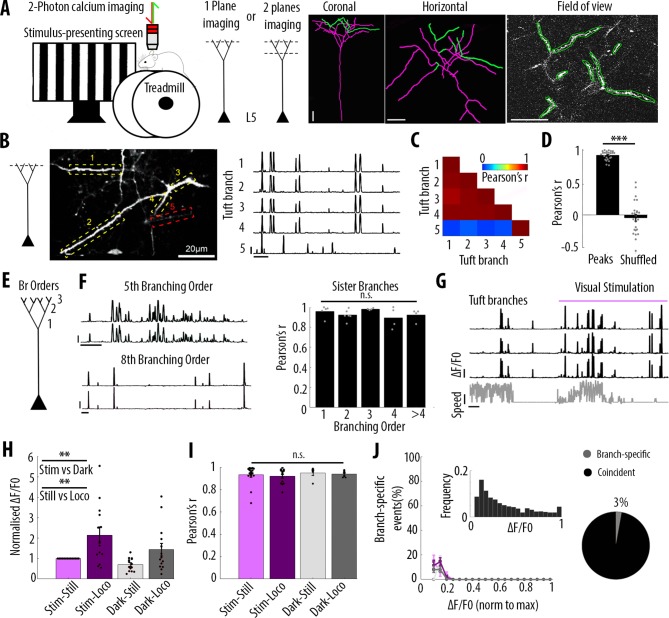
Figure 1. Highly correlated activity in the whole apical tuft of layer 5 pyramidal neurons.
(A) Schematic of the methodological approach. Calcium transients were recorded either in multiple apical tuft dendrites in a single focal plane, or semi-simultaneously in different compartments of individual neurons (Soma, Trunk and Tuft). At the end of each imaging session, a z-stack was recorded for post-hoc reconstruction of each imaged neuron. (B) Single plane imaging of the apical tuft branches of an individual layer 5 neuron. GCaMP6f-calcium transients of the apical tuft branches belonging to one neuron are shown in traces 1 to 4 while calcium transients of a tuft branch belonging to a different neuron is shown in trace 5. Scale bars, 0.3 ΔF/F0 (normalised to max), 20 s. (C) Pearson’s correlation matrix between the calcium transients of the branches shown in B. Branches that belong to the same neuron (branches 1 to 4, neuron 1) have a mean Pearson’s correlation of 0.96, while the branch that belongs to the different neuron (branch 5, neuron 2) has a mean Pearson’s correlation value of 0.13 with neuron 1’s branches. (D) Mean Pearson’s correlation value between tuft dendrites calcium transient peak amplitudes for each imaged field of view and corresponding shuffled data (Paired t-test, p=3.5e−15; mean = 0.92 and −0.04, sem = 0.01 and 0.05 for branches and shuffled data, respectively; n = 25 fields of view; coming from 14 neurons; six animals; 70 branches). (E) Schematic of the definition of branching orders. (F) Two representative traces of sibling branches belonging to the 5th and 8th branching order and a quantification of the Pearson’s correlation for sibling tuft branches of different branching orders (right panel). (For 1st, 2nd, 3rd, 4th and more than 4th branching order, One-way ANOVA, p=0.34; mean = 0.96; 0.92; 0.98; 0.89; 0.92, sem = 0.02; 0.02; 0.01; 0.05; 0.03, n = 5; 6; 4; 4; 4 pairs of branches, respectively). Scale bars, 0.3 ΔF/F0 (normalised to max), 20 s. (G) Representative traces of 3 tuft branches belonging to the same neuron while the animal was either stationary or running (grey signal, speed) during either darkness or the presentation of drifting gratings (purple segment). Scale bars, 12 cm/s, 0.3 ΔF/F0 (normalised to max), 20 s. (H) Mean ΔF/F0 for apical tuft dendrites during darkness (dark) and visual stimulation (stim) while the animal was either stationary (still) or running (loco). Bar graph is normalised to visual stimulation during stationary condition. Both visual stimulation and locomotion significantly increase the mean ΔF/F0 of tuft branches without any interaction effect (Repeated Measures Two-way ANOVA on log-transformed data, p=0.005, 0.003 and 0.99 for stim, loco and interaction effects respectively, mean (normalised to condition stim/still)=1; 2.15; 0.7; 1.4, sem = 0; 0.38; 0.08 and 0.3, n = 14 neurons). (I) Pearson’s correlation coefficients between tuft dendrites calcium transients of individual neurons during stim-still, stim-loco, dark-still and dark-loco conditions. (Two-way ANOVA, p=0.43, 0.62 and 0.97 for stim, loco and interaction effects; mean = 0.93; 0.92; 0.95 and 0.94, sem = 0.02; 0.02; 0.02; 0.01, n = 16; 14; 5 and 7 fields of views respectively, from 14 neurons). (J) Proportion of branch-specific events as a function of GCaMP6f calcium transients’ amplitude for the four different conditions (left panel). Neither visual stimulation nor locomotion nor an interaction effect significantly increased the number of branch-specific events (Three-way ANOVA, p=0.29; 0.8 and 0.94, respectively; p<10−15 for event amplitude; n = 70 branches from 14 neurons; 6 animals). Inset, frequency distribution of the calcium transients’ amplitudes detected in the apical tuft branches. Right panel, pie chart showing that, on average, 3% of all calcium transients were detected as branch-specific (detected in one apical tuft dendritic branch and not detected in the other imaged branches).


