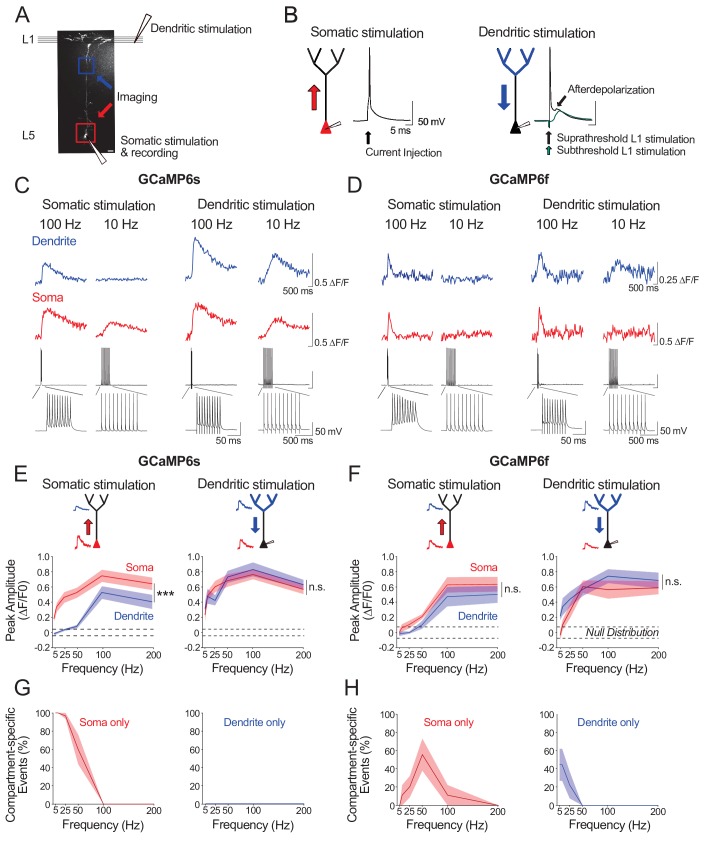
Figure 4. Ex vivo calibration of GCaMP6s and GCaMP6f signals in soma and apical tuft dendrites.
(A) Experimental schemata. Layer 5 pyramidal neurons expressing GCaMP6s or GCaMP6f were recorded using whole-cell patch clamp in acute cortical slices of the primary visual cortex. An example neuron is shown (scale bar = 20 μm). The soma and distal apical dendrite (nexus) were imaged during neuronal spiking, driven either by suprathreshold somatic current injection (somatic stimulation) or layer 1 (L1) stimulation (dendritic stimulation), respectively. Somatic and dendritic stimulation consisted of a train of 10 pulses delivered at 5–200 Hz. (B) Examples of action potentials driven by somatic and dendritic stimulation. Action potentials triggered by dendritic stimulation were additionally accompanied by an enhanced afterdepolarization reminiscent of a dendritic spike, which had a faster rise time than subthreshold EPSPs and were absent from somatically-evoked action potentials. (C, D) Example calcium transients imaged in the soma and apical dendrite during somatic and dendritic stimulation in a L5 neuron expressing GCaMP6s (C) and GCaMP6f (D). Concurrent somatic electrophysiological recordings are shown below each transient. Negative deflections in electrophysiological traces are stimulation artefacts that have been cut for clarity. (E, F) Average peak amplitude of calcium transients recorded in the soma (red) and dendrites (blue) during somatic and dendritic stimulation for GCaMP6s (E) and GCaMP6f (F). Null distribution of peak amplitudes from sham stimulation trials are shown (dashed horizontal lines). (G, H) Proportion of compartment-specific events detected either in the soma or dendrite during somatic or dendritic stimulation for GCaMP6s (G) and GCaMP6f (H). Shaded areas represent S.E.M. Significance was assessed with two way (E, F) and one way (G, H) repeated measures ANOVA with post-hoc Sidak tests. Asterisks (***) in (E,F) denote factor (soma vs dendrite) significance of p<0.0001; n.s. denotes non-significance; significance is not shown for other comparisons but is listed below. For somatic stimulation in (E): soma vs. dendrite: p<0.0001 for all frequencies; soma vs. null: p<0.0001 for all frequencies; dendrite vs null; p<0.0001 for frequencies > 50 Hz, p>0.44 for frequencies < 50 Hz. For dendritic stimulation in (E): soma vs. dendrite: p>0.11 for all frequencies; soma vs null: p<0.0001 for all frequencies; dendrite vs null: p<0.0001 for all frequencies. For somatic stimulation in (F): soma vs. dendrite: p>0.49 for>25 Hz, p=0.074 for 10 Hz, p=0.054 for 5 Hz; soma vs. null: p<0.0001 at>100 Hz, p=0.09 at 50 Hz, p>0.7 at<50 Hz; dendrite vs. null: p<0.0001 at>100 Hz; p>0.52 at<50 Hz. For dendritic stimulation in (F): soma vs. dendrite: p>0.32 for all frequencies; soma vs. null: p<0.0001 at>50 Hz, p<0.01 at 25 Hz, p>0.47 at<10 Hz; dendrite vs. null: p<0.0001 at>25 Hz, p<0.002 at 10 Hz, p=0.11 at 5 Hz. For somatic stimulation in (G): soma vs null: p<0.0001 for<50 Hz, p>0.44 for>100 Hz. For dendritic stimulation in (G): dendrite vs null: p>0.11 for all frequencies. For somatic stimulation in (H): soma vs null: p<0.0001 for 50 Hz; p>0.12 for all other frequencies. For dendritic stimulation in (H): dendrite vs null: p<0.02 for 5 Hz, p=0.10 for 10 Hz, p>0.48 for>25 Hz. GCaMP6s: n = 10 cells from 4 animals except for 5 Hz stimulation, where n = 5 cells from 3 animals; GCaMP6f: n = 9 cells from 3 animals.


