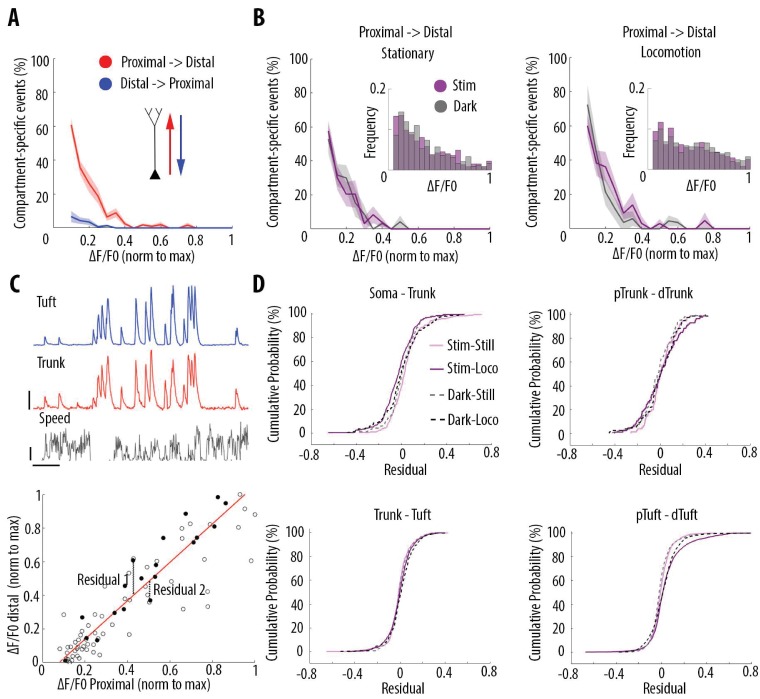
Figure 5. Locomotion and visual stimulation do not alter the relationship between somatic and dendritic calcium transients in layer 5 pyramidal neurons.
(A) Mean proportion of compartment-specific calcium transients as a function of calcium transient amplitude (average of data points from Figure 3C (i–iv)). In red, proportion of events only detected in the proximal compartment. In blue, proportion of events only detected in the distal compartment. Thick line and shaded area: weighted mean and sem for each bin (0.05), respectively. Event amplitude, compartment (proximal vs distal) and an interaction between these two factors significantly affected the proportion of compartment-specific events (Two-way ANOVA, p<10−15, p<10−15, p<10−15, n = 31 pairs of compartments from 19 neurons). (B) Proportion of compartment-specific events detected in the proximal compartment and not in the distal one, as a function of calcium transient amplitude, during periods of darkness (grey) and visual stimulation with drifting gratings (purple), while the animals were either stationary (left panel) or running (right panel). Upper right panel, frequency histogram of calcium transient peak amplitudes detected in proximal compartments during darkness (grey) and visual stimulation (purple). Peak amplitudes were normalized to the maximum amplitude in each compartment. Neither visual stimulation nor locomotion altered the function relating calcium transients amplitude with the proportion of compartment-specific events (Three-way ANOVA, p=0.69, p=0.21 and p=0.64 for visual stimulation, locomotion, and interaction respectively; p<10−15 for event amplitude. No other interaction was found to be statistically significant). (C) Upper panel, example traces of a proximal (trunk, red) and distal (tuft, blue) compartment imaged semi-simultaneously, during stationary and locomotion periods (black trace, speed). Scale bars, 0.25 ΔF/F0 (normalised to max), 12 cm/s, 20 s. Lower panel, example of scatter plot of calcium transients’ peak amplitudes imaged in a pair of neuronal compartments (trunk-tuft). Each dot represents an individual calcium transient. Filled dots correspond to the transients shown in the upper panel. The red line represents the robust linear regression fit. For each transient, a residual from the robust linear regression was calculated. (D) Cumulative distributions of the residuals calculated for each pair of compartments and for each condition: visual stimulation (pink, stim), darkness (grey, dark), stationary (still) and locomotion (loco) periods. No significant difference was found between any condition: Three-way ANOVA, p=0.96, p=0.23 and p=0.91 for visual stimulation, locomotion and interaction effect, respectively; p=0.86 for different neuronal compartments. No other interaction effect was found to be significant. n = 31 compartments (n = 11 Soma-Trunk; n = 5 pTrunk–dTrunk; n = 9 Trunk–Tuft; n = 6 pTuft-dTuft from 19 neurons).


