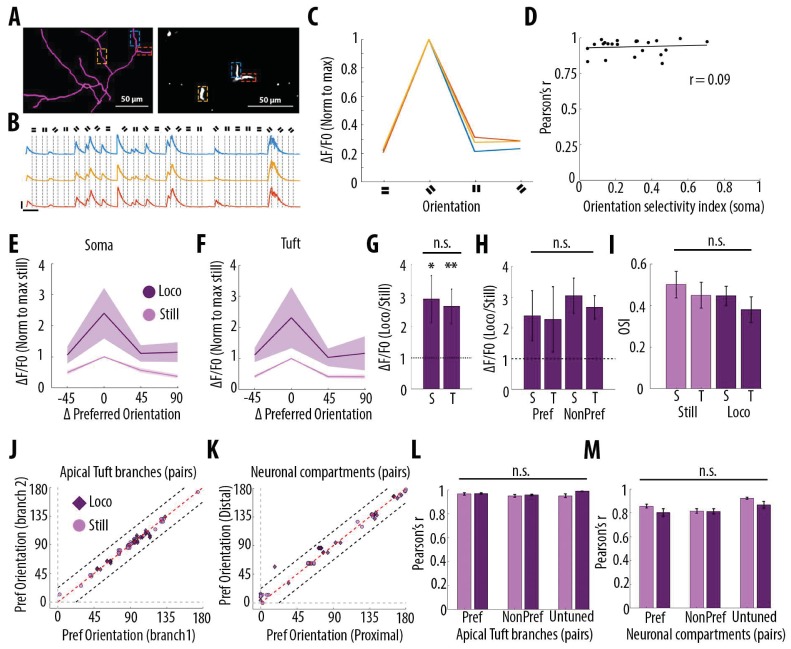
Figure 6. Orientation selectivity does not alter the relationship between somatic and dendritic calcium transients in layer 5 pyramidal neurons.
(A) Morphological reconstruction (left) and two-photon image (right) of apical tuft branches of one individual neuron imaged during the presentation of drifting gratings. (B) Example GCaMP6s transients from the dendritic branches indicated by coloured dashed lines in panel A, during the presentation of drifting gratings of four different orientations. Dotted lines indicate the beginning and the end of drifting gratings stimulation. Scale bars 0.3 ΔF/F0 (normalised to max), 10 s. (C) Tuning curve showing calcium transients amplitudes (normalised to max) in response to the four grating orientations (average of 24 presentations of each grating, ), from the three branches indicated by coloured dashed lines in panel A. (D) Mean Pearson’s correlation value of all imaged tuft dendritic branches per neuron, as a function of the orientation selectivity of the corresponding soma (each dot corresponds to one neuron; r2 = 0.09, p=0.67, n = 23 neurons). The straight black line represents the best fit line (least square). (E) Tuning curve of somatic calcium signals from orientation selective neurons (somatic OSI >0.3; n = 15 neurons) during stationary (still, pink) and locomotion (loco, purple) periods. Responses are normalised to the preferred orientation during stationary periods. Thick line and shaded area represent the mean and SEM, respectively. (F) Same as E, for the corresponding apical tuft branches of the same neurons. For each neuron, responses from all imaged apical tuft branches were averaged (n = 68 apical tuft branches from 15 neurons). (G) Relative increase in calcium transient amplitudes during locomotion compared to stationary periods both in soma (S) and in corresponding apical tuft dendrites (T), during drifting grating presentations. Locomotion significantly increased responses to drifting gratings both in soma and corresponding apical tuft dendrites (Repeated Measures Two-way ANOVA on log transformed data, p=0.02 and p=0.008 for the effect of locomotion on soma and tuft responses, respectively, n = 15 neurons) without a significant difference between compartments (Paired t-test, p=0.38; mean (normalised to stationary)=2.89 and 2.65, sem = 0.74 and 0.56; n = 15 soma and 15 apical tufts including 68 branches). (H) Same as G for responses to the preferred (Pref) and non-preferred (NonPref) orientations (Repeated measures Two-way ANOVA on log-transformed data, p=0.07, 0.71 and 0.28 for orientation, compartment and interaction effects respectively; mean = 2.4 and 2.28, sem = 0.81 and 1.06 for soma and apical tuft at the preferred orientation; mean = 3.05 and 2.67, sem = 0.57 and 0.38 for soma and apical tuft at the non-preferred orientation; n = 15 soma and 15 apical tufts). (I) Orientation selectivity index was not significantly different between somatic and corresponding tuft dendrites responses, both during stationary (still) and locomotion (loco) periods (Repeated measures Two-way ANOVA, p=0.49, p=0.42 and p=0.45, for the effects of locomotion, neuronal compartment (soma vs tuft) and interaction, respectively; mean = 0.5; 0.45, sem = 0.06, 0.06 for soma and apical tuft during stationary and mean = 0.45; 0.38, sem = 0.05, 0.06 for soma and apical tuft during locomotion, respectively; n = 15 soma and 15 apical tuft including 68 branches). (J) Scatter plot of the preferred orientation in pairs of apical tuft branches belonging to the same neuron and imaged simultaneously, during stationary (pink circles) and locomotion (purple diamonds) periods (n = 31 pairs). Dashed red line: identity line; Dashed black lines: identity +/- 22.5 degrees. (K) Same as J for pairs of neuronal compartments imaged simultaneously. n = 33 pairs. (L) Pearson’s correlation of calcium transients between pairs of apical tuft branches belonging to the same orientation-selective neuron, during the presentation of the preferred (Pref) and non-preferred (NonPref) grating orientations, both during stationary (pink) and locomotion (purple) periods (n = 31 pairs). Correlation values from branches belonging to non-selective neurons (OSI <0.3, untuned), during the presentation of all oriented gratings, are shown on the right columns (n = 10 pairs). Neither gratings orientation nor locomotion significantly affected the correlation between pairs of branches (Two-way ANOVA, p=0.20, p=0.07 and 0.38 for orientation, locomotion and interaction effect, respectively). (M) Same as L, for different neuronal compartments (Two-way ANOVA, p=0.27, p=0.09 and 0.43 for orientation, locomotion and interaction effect, respectively; n = 33 pairs for Pref, NonPref and 36 pairs for untuned). Error bars: SEM.

