. 2020 Jan 21;9:e51419. doi: 10.7554/eLife.51419

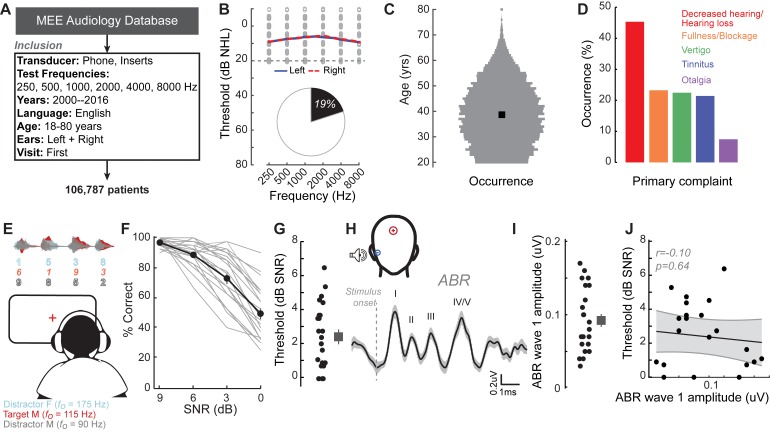
Figure 1. A normal audiogram does not guarantee robust speech intelligibility in everyday listening conditions.

(A) Screening criteria for eligible audiology patient records from our hospital collected between 2000 and 2016. (B) Bilateral normal audiograms, defined as thresholds better than 20 dB HL (gray dashed line) were identified in 19% of the total patient population. Average audiograms from the left (blue) and right (red) ears are shown with individual data points in gray open circles. (C) Normalized age distribution of patients with bilateral normal audiograms shows a larger percentage of younger and middle-aged patients between 20–50 years of age. Black square indicates median age of 39 years. (D) Top five primary complaints that resulted in the visit to the clinic for these patients, including perceived hearing loss or decreased hearing presenting in 45% of these patients. (E) Schematic of a multi-talker digit recognition task. Subjects (N = 23) were familiarized with a target male speaker (red) producing four digits between 1 and 9 (excluding the bi-syllabic ‘7’), while two spatially co-localized distractors, one male and one female, with F0 frequencies above and below the target speaker simultaneously spoke four digits at varying signal-to-noise ratios (SNRs). (F) Accuracy decreased as a function of SNR at variable rates and to variable degrees. Correct trials required correctly reporting all four digits. (G) Variability in individual speech reception thresholds, defined as the SNR that produced a 70.7% success rate. Value at right represents sample mean ± SEM. (H) Auditory brainstem responses measured using ear canal tiptrodes yielded robust wave one amplitudes, a marker for auditory nerve integrity. Data reflect mean ± SEM. (I) Wave one values from individual subjects (left) and mean ± SEM of the sample (right). (J) No significant associations were observed between the ABR wave one amplitudes and speech reception threshold on the multi-talker digit task. r = Pearson’s correlation, and shaded area indicates 95% confidence intervals of the regression line (black) in Figures 14.

Figure 1—source data 1. Digits comprehension thresholds and ABR wave one amplitudes.

Figure 1.

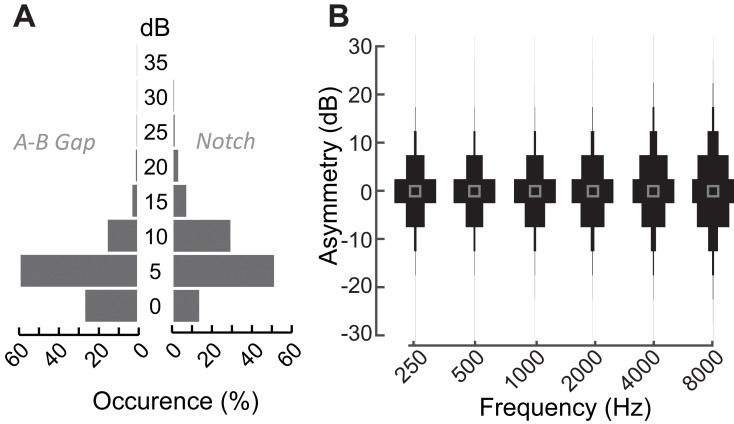
Figure 1—figure supplement 1. Audiometric characteristics of patients with normal audiograms that present at the Massachusetts Eye and Ear audiology clinic with complaints of poor hearing.

Figure 1—figure supplement 1.

(A) Distribution of air-bone gaps, that is differences in pure tone thresholds measured via air conduction and bone conduction suggests the absence of any conductive hearing loss in these patients with normal audiograms at any test frequency (left). These patients also did not exhibit large focal threshold shifts (notches) in the audiograms, which are indicative of significant noise damage (right) (Fausti et al., 1981; Mehrparvar et al., 2011; Le Prell et al., 2013) (B) Normalized distribution plots of the difference in hearing thresholds between the right and left ears at the various test frequencies indicate the lack of significant between-ear asymmetries. Hence by all clinical measures of hearing, these patients coming in to the clinic with hearing difficulties are considered to be audiometrically ‘normal’.
Figure 1—figure supplement 2. Audiometric profiles and markers of noise exposure in study participants.

Figure 1—figure supplement 2.

(A) Audiograms from the right ear of the 23 participants in this study, indicating normal hearing thresholds for test frequencies up to 8 kHz. Similar thresholds were present in the left ear (data not shown). Individual audiograms are in gray, and the mean audiogram in black. Unshaded region represents the range of normal thresholds. (B) High frequency audiograms, considered an early marker for noise damage, showed wide variability in these individuals with normal thresholds in the lower frequencies. (C) This came as something of a surprise, as listeners reported lifetime levels of noise exposure that are deemed safe by the EPA, and well below unsafe levels recommended by OSHA and NIOSH. These data suggested that subjective self-reports of noise damage may underestimate the degree of noise damage present in these listeners and that extended high-frequency audibility may be one source of explanation for poor speech processing in noise. (D) However, the correlation between the high frequency thresholds and performance on the digits comprehension task was not statistically significant. r = Pearson’s correlation, and shaded area indicates 95% confidence intervals of the regression line (black).
Figure 1—figure supplement 2—source data 1. High-frequency audiometry and noise exposure questionnaire values.
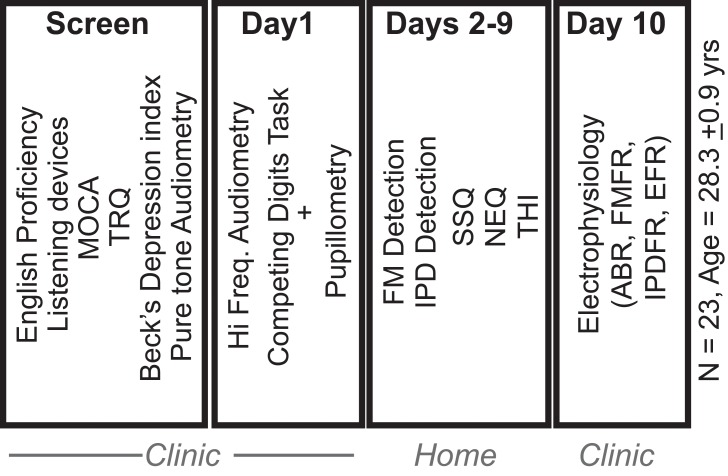
Figure 1—figure supplement 3. Experimental study design.

Figure 1—figure supplement 3.

Of the 27 subjects who provided informed consent to participate in the study, 23 were found to be eligible, based on initial screening for English proficiency, use of listening devices, executive function (Montreal Cognitive Assessment, MOCA), depression (Beck’s depression index), tinnitus (Tinnitus Reaction Questionnaire, TRQ) and pure tone audiometry. Eligible participants completed a set of behavioral and physiological test in the clinic. They were then sent home with tablets and calibrated head phones to perform additional testing for 8 days. Subjects returned to the clinic with the tablet for a final day of electrophysiological testing.
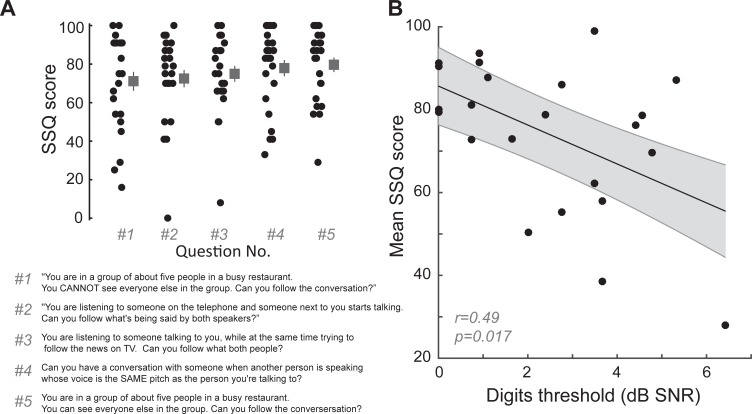
Figure 1—figure supplement 4. Digits comprehension task captures aspects of self-reported difficulties in real-world multi-talker listening conditions experienced by the participants.

Figure 1—figure supplement 4.

(A) Questions related to hearing in multiple-speaker situations questions from the speech, spatial and qualities of hearing scale (SSQ) were among the top five answers that showed the maximum variability in responses in our participants. Participants answered on a sliding scale with 100 meaning ‘perfectly’ and 0 meaning ‘not at all’. (B) Mean scores on these five questions in the SSQ correlated with the participants’ performance on the digits comprehension task, indicating that the task captures self-reported difficulties of these participants in real world listening scenarios. r = Pearson’s correlation, and shaded area indicates 95% confidence intervals of the regression line (black).
Figure 1—figure supplement 4—source data 1. Mean values from the SSQ questionnaire.
HHS Vulnerability Disclosure