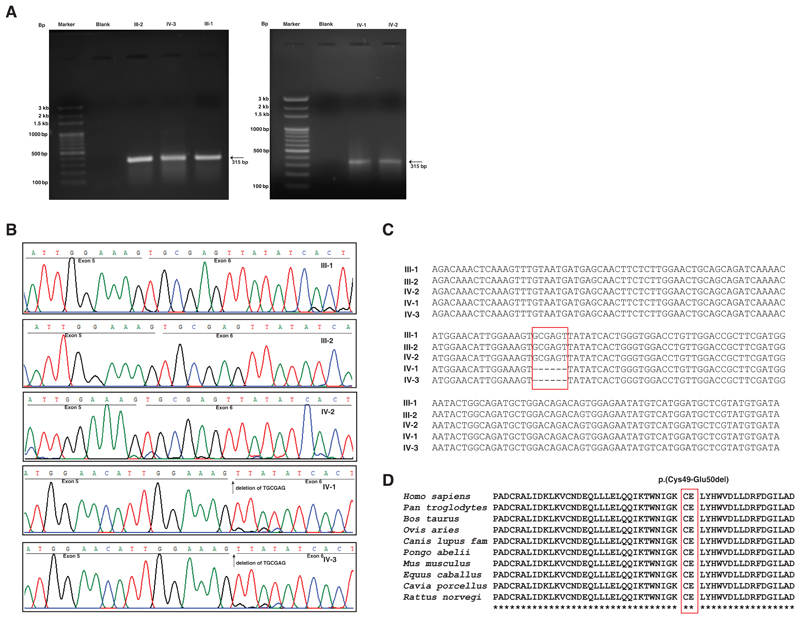
Figure 3. Transcript analysis of patients (IV1 and IV-3), unaffected sister (IV-2) and unaffected parents (III-1 and III-2) assessed using reverse transcription-PCR and Sanger sequencing.
A) Agarose gel images of reverse transcription-PCR product across brother of proband (IV-3), unaffected parents (III-1 and III-2), proband (IV-1) and unaffected sister (IV-2) as compared to the ladders M1 and M2. A single band at ~315 bp was observed in all the three samples which is the targeted amplicon size. B) Sanger sequencing of patients (IV-1 and IV-3), unaffected sister (IV-2), unaffected mother (III-2) and father (III-1). The underlined sequences depict the regions corresponding to exon 5 and exon 6 (black). Deletion of the 6 nucleotides is observed in both the patients but not in the unaffected parents or the sister. The sequences of carrier mother and unaffected sister are same as that of reference sequence indicating that the mother had X-inactivation of the mutant X-chromosome. C) Depiction of deletion of six nucleotides in patients using multiple sequence alignment of transcript sequences obtained by Sanger sequencing of cDNA from parents, unaffected sister and the two patients. The red rectangle indicates the 6 nucleotides that are deleted in patients. D) Conservation analysis of HUWE1 protein sequence surrounding the two amino acids that are deleted p.(Cys49-Glu50del) (marked in red).

