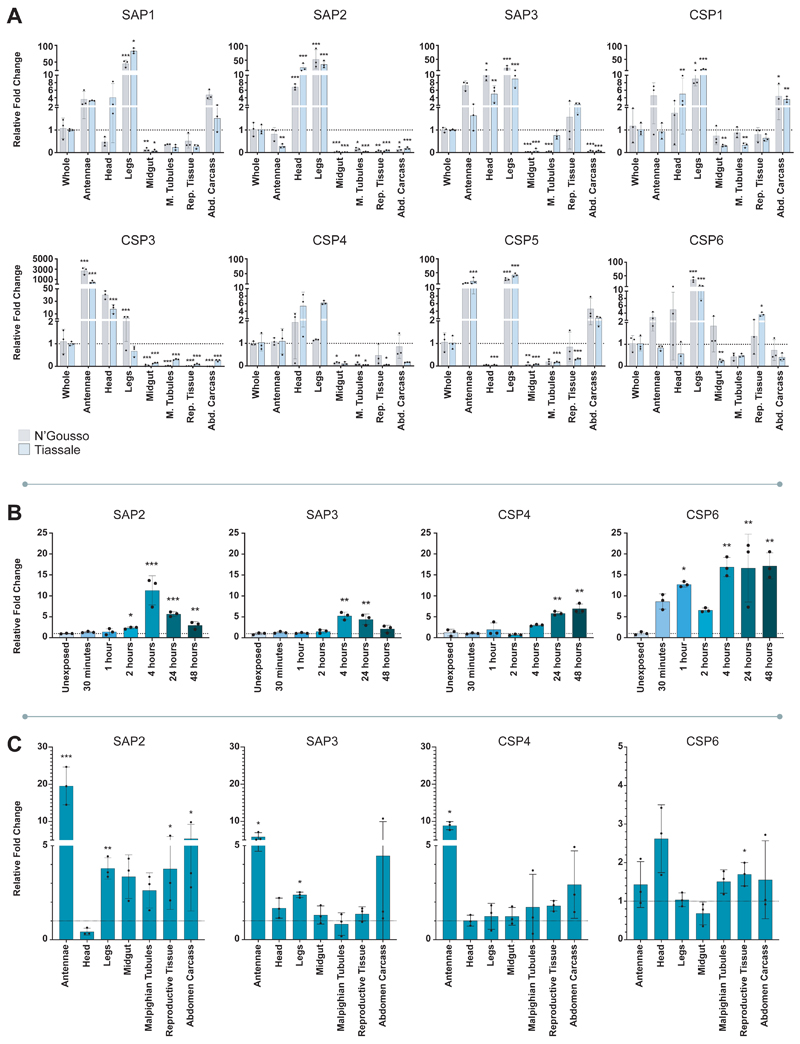
Figure 1. CSP expression profiles.
A. Constitutive expression of CSPs in resistant and susceptible strains. mRNA localisation in antennae, head, legs, midgut, Malpighian tubules, reproductive tissue and the remaining abdominal tissues (abdomen carcass) in N’Gousso (grey) and Tiassalé (blue) for each member of the CSP family compared to whole body. B. Induction of CSPs in Tiassalé following pyrethroid exposure. Four CSPs show significant induction of mRNA expression at different time points post-exposure to the pyrethroid insecticide deltamethrin in Tiassalé (results for the non-induced CSPs are shown in Extended Data Figure 3a). C. Tissue-specific profile of CSPs induction in Tiassalé. Tissue-specific induction for the four significantly induced CSPs in the Tiassalé strain, shown 4-hours post deltamethrin exposure, each data point shows exposed compared to unexposed tissues from the same generation (see Extended Data Figure 3b for remaining CSPs). The qPCR data show mean ± standard deviation of three biological replicates. * p ≤ 0.05; ** p ≤ 0.01; *** p ≤ 0.001. Statistical significance was calculated by an ANOVA followed by Dunnett’s post hoc test; where normalisation was not possible, data was analysed using Kruskall-Wallis followed by a Dunn’s post hoc test in A. and B. In C. significance was calculated by a two-tailed t-test; p-values are provided in Supplementary Table 2; n = 3 for each replicate.

