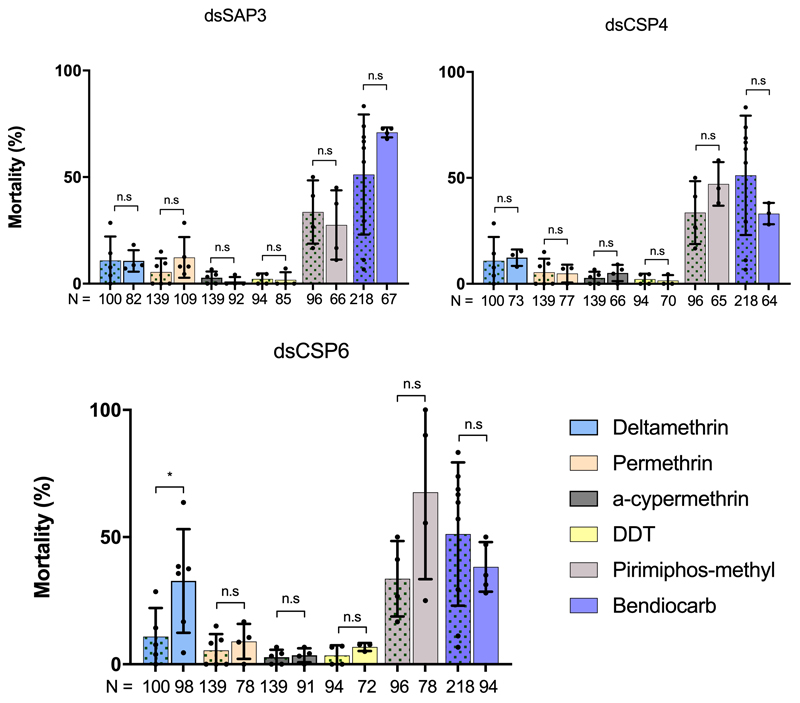
Extended Data Figure 5. Phenotype of other induced CSPs to a panel of insecticides.
Effect of attenuation of (a) dsSAP3 (ndeltamethrin = 4; npermethrin = 5; nα-cypermethrin = 3; nDDT = 3; npirimiphos-methyl = 3; nbendiocarb = 4) (b) dsCSP4 (ndeltamethrin = 3; npermethrin = 3; nα-cypermethrin = 3; nDDT = 3; npirimiphos-methyl = 3; nbendiocarb = 3) and (c) dsCSP6 (ndeltamethrin = 6; npermethrin = 4; nα-cypermethrin = 4; nDDT = 3; npirimiphos-methyl = 4; nbendiocarb = 5) on mortality after insecticide exposure in Tiassalé mosquitoes (right bars) compared to dsGFP injected controls (left bars, green patterned; ndeltamethrin = 5; npermethrin = 5; nα-cypermethrin = 5; nDDT = 4; npirimiphos-methyl = 4; nbendiocarb = 8). Analysis of mortality data was done using an ANOVA test followed by a Tukey post hoc test, n.s indicates a non-significant change in mortality, * p ≤ 0.05. dsCSP6 μmortality = 11.7% to 31.6%, p = 0.0474. N shows number of individual mosquitoes used for phenotyping; points show the number of bioassay replicates per group. Error bars show standard deviation.

