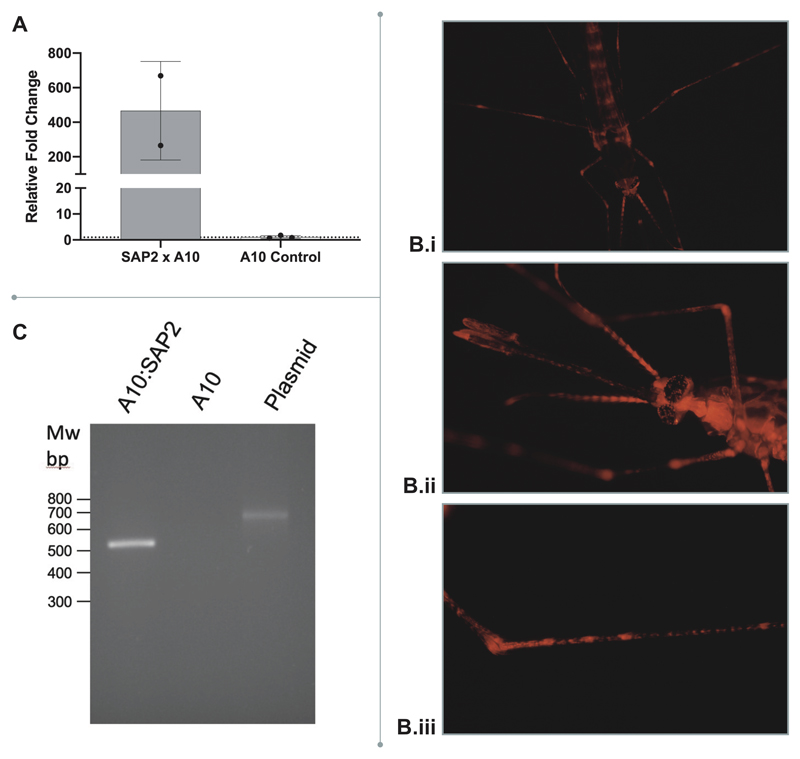
Extended Data Figure 6. Characterisation of SAP2 in the transgenic line.
A. Mean mRNA expression of SAP2 overexpression in the SAP2 x A10 transgenic line (n=2) compared to SAP2 in the A10 x G3 control (n = 3). Error bars represent standard deviation and points show each biological replicate. B. mCherry under the Polyubiquitin c A10 promoter demonstrating (i) ubiquitous expression; (ii) expression in the head; (iii) expression in the legs as shown previously by Adolfi et al. 2018; these results were tested across over a hundred independent mosquito screenings. C. Intron splicing confirmed by PCR in A10 x SAP2 and negative control A10 mosquitoes compared to plasmid DNA: pUAS-SAP2. Size of PCR product with and without synthetic intron 647bp and 534bp, respectively. MW: 100bp DNA ladder. 2 samples A10 x SAP2 and 2 control samples A10 (each sample: pool of 5 females, 4 days old, unfed) were tested and repeated in two PCRs.

