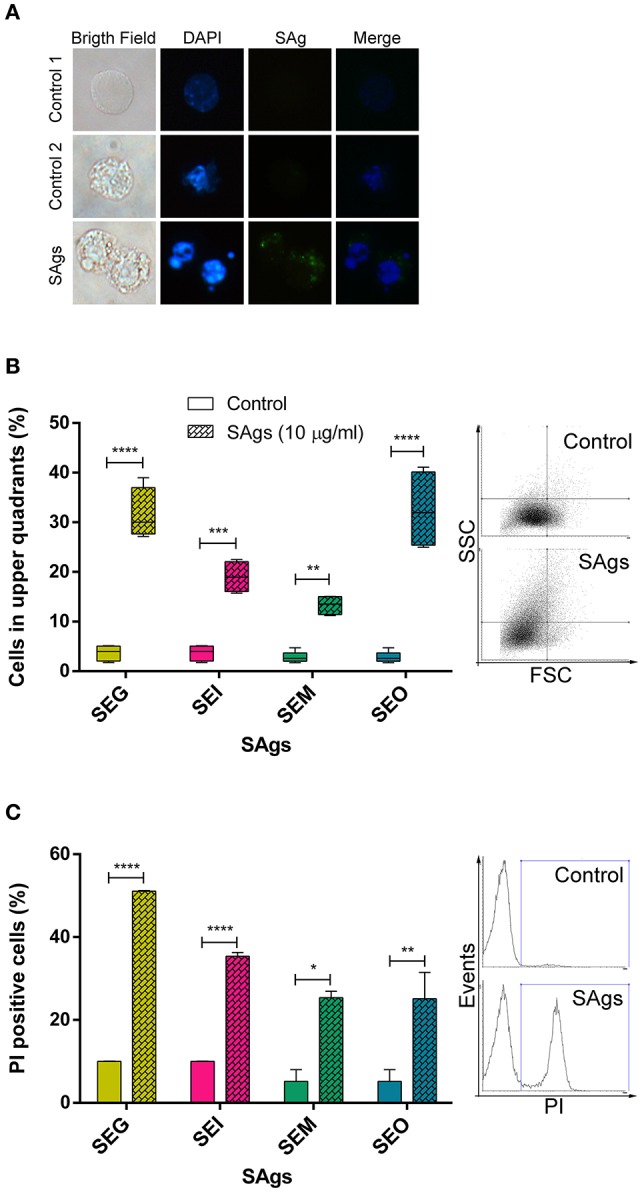
Figure 3.

SAgs of the egc operon induced monocytic cell death. (A) After 48 h of incubation with SAgs, THP-1 cells were labeled with fluorescent antibodies and observed under the microscope; DNA is shown in blue and SAgs in green. In the first column, images in bright field are shown. The upper panel shows the control condition with untreated cells. In the middle and lower panels, monocytes treated with SAgs are shown. In the middle panel, control 2, cells were incubated with a normal mouse serum and then stained with fluorescent antibodies. In all cases, representative images are shown. (B) Cellular complexity was determined as an increment of cells in the upper quadrants of FSC vs. SCC dot plot. THP-1 cell complexity was assessed by flow cytometry after 48 h of incubation with SAgs. For this purpose, THP-1 cells were gated for singlets, and then the monocytic population was evaluated by FSC and SCC. Values are expressed as percentage of cells in the upper quadrants. Representative dot plots are shown on the right. (C) THP-1 cells were incubated with SAgs for 48 h and then stained with FDA/PI. In this case, after singlet cell and monocytic population selection, the percentage of PI+ cells was measured for every SAg treatment and its basal. Values are expressed as the percentage of PI+ cells. Representative histograms are shown on the right. Data are expressed as the mean ± SEM of at least three independent experiments. Asterisks represent statistical significance with respect to untreated cells: *p < 0.05, **p < 0.01, ***p < 0.001, ****p < 0.0001.
