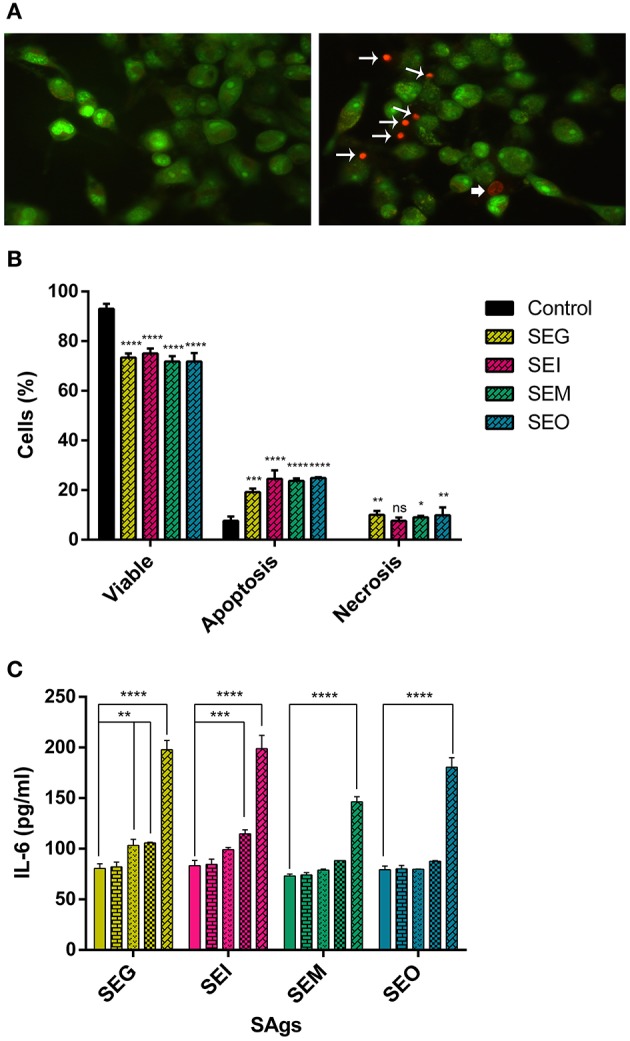
Figure 7.

PMA THP-1 differentiated cells are more sensitive than THP-1 cells to the SAg effect. Acridine orange-ethidium bromide staining of PMA-treated THP-1 cells under different treatment conditions (representative images). (A) Control THP-1/PMA cells (left panel) and SAgs treatment (right panel) are shown. Asterisks indicate early apoptosis cells, regular arrows show late apoptosis cells, and wide arrows show necrosis. (B) Viability and type of death percentage of THP-1/PMA cells treated with SAgs or untreated (control). The result is based on the analysis of live and apoptotic/necrotic cells following acridine orange-ethidium bromide (AO/EtBr) staining. (C) Cytokines were measured in supernatants by ELISA; production of IL-6 is shown. Values are expressed in pg/ml. Data are expressed as the mean ± SEM of at least three independent experiments. Asterisks represent statistical significance with respect to untreated cells: *p < 0.05, **p < 0.01, ***p < 0.001, ****p < 0.0001.
