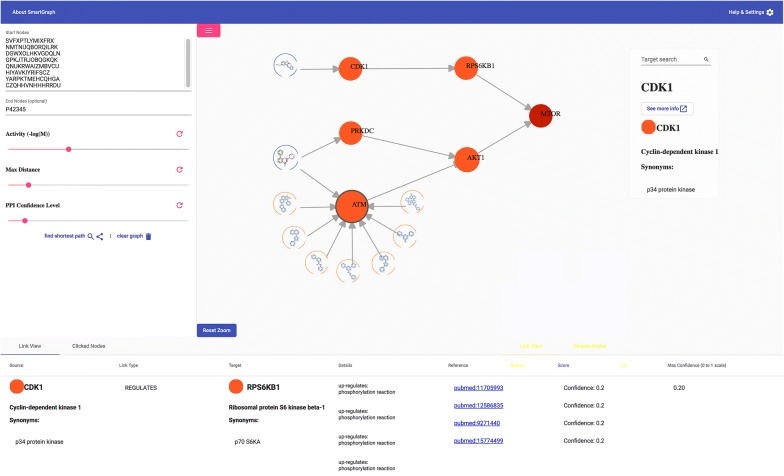
Fig. 2.
Web-based graphical user interface (GUI) of SmartGraph. Shown is an example network that was generated by 8 compounds and one destination target and after adjusting parameters k = 2, p = 3 and c = 0.10 in the control panel. The structures of two compounds are oriented on the left-hand side of the subnetwork. The structures of pattern nodes (BM-scaffolds) are outlined in blue, and their nodes are embordered by a yellow line. The end node is colored by dark red, whereas other targets are colored by orange. These targets constitute the shortest paths between the compounds and the destination target

