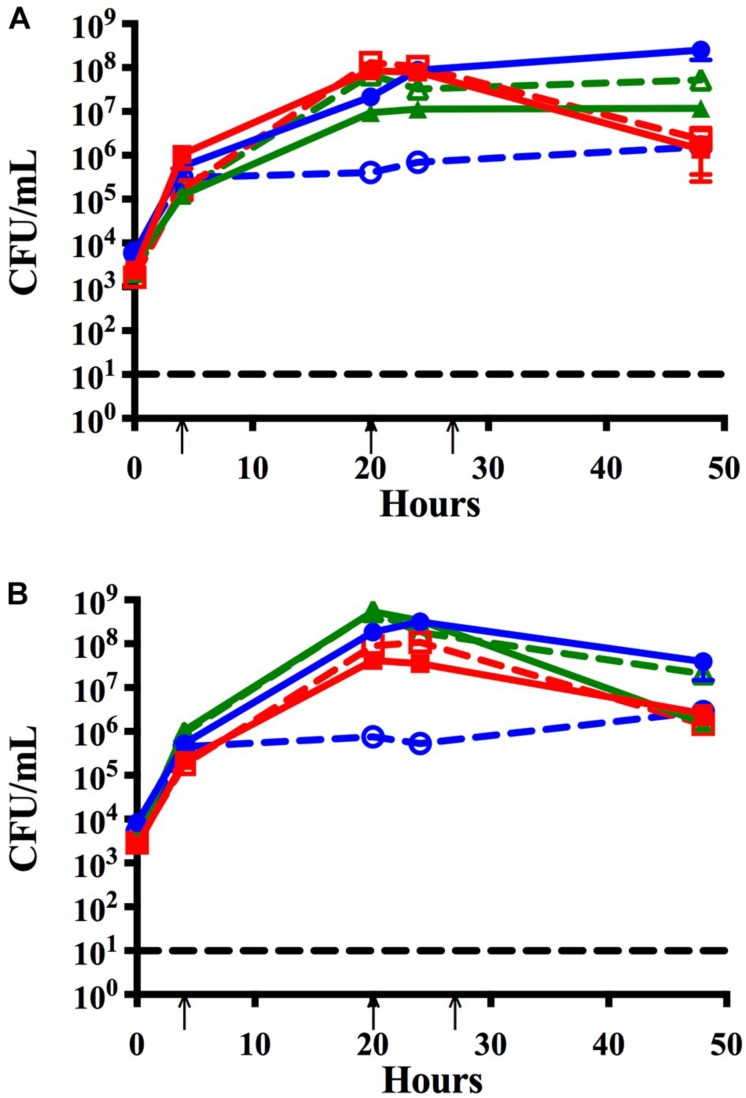
FIGURE 3.
Time course assay to assess the effects of lower seeding concentrations and address strain specificity by analyzing trends of co-infection isolates. Bacteria seeded simultaneously at a lower concentration (∼105 CFU per mL) and maintained with media changes (black arrows) for 48 h in monomicrobial (dashed) or triple species (solid) biofilms. Each symbol and error bar represent the mean CFU per mL and standard deviation (SD) of biofilms at the respective time point. Data presented are from three independent assays with a minimum of two biologic replicates per assay. Black dashed line indicates the limit of CFU detection. (A) NTHi86-028 NP (blue), M. catarrhalis 7169 (green), and S. pneumoniae EF3030 (red) monomicrobial and triple species biofilms. (B) NTHi 11-01-125 (blue), M. catarrhalis 11-01-125 (green) and S. pneumoniae 11-01-125 (red) monomicrobial and triple species biofilms.

