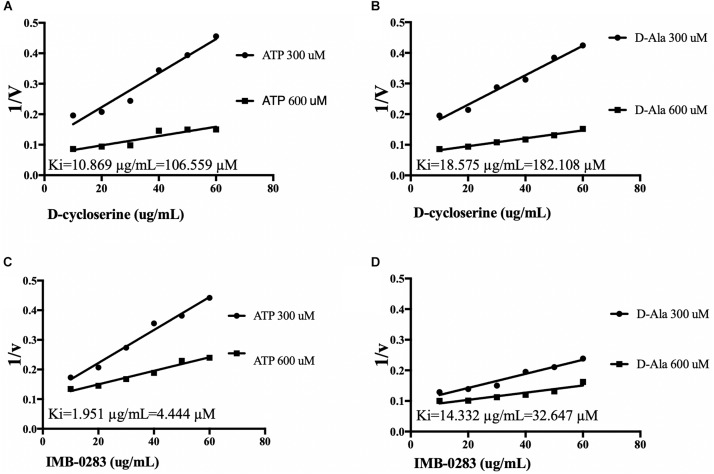
FIGURE 4.
Ki values of inhibitors calculated by Dixon-plots for DdlA. Reactions were monitored when inhibitors varied from 10 to 60 μg/mL, while one substrate was fixed at 1000 μM and the other substrate was either 300 or 600 μM (n = 3). Panels (A,B) show the Ki values of DCS to DdlA. Panels (C,D) show the Ki values of IMB-0283 to the enzyme.

