Fig. 12.

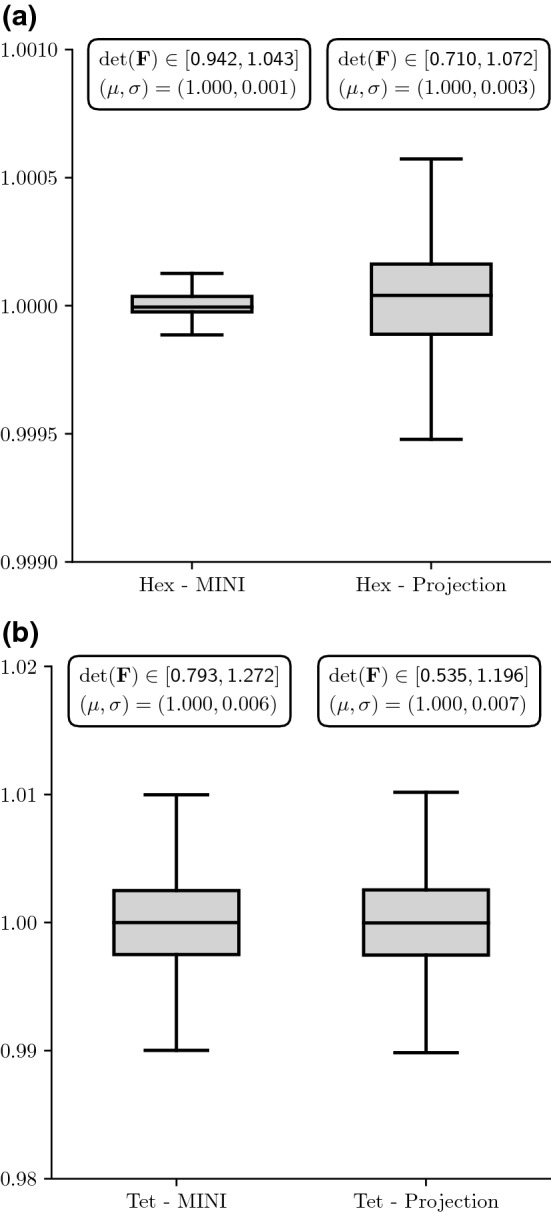
Cook-type cantilever problem: boxplots showing the distribution of for a hexahedral and b tetrahedral elements. Additionally, the minimal and maximal value, as well as the mean () and the standard deviation () is given for each setting

Cook-type cantilever problem: boxplots showing the distribution of for a hexahedral and b tetrahedral elements. Additionally, the minimal and maximal value, as well as the mean () and the standard deviation () is given for each setting