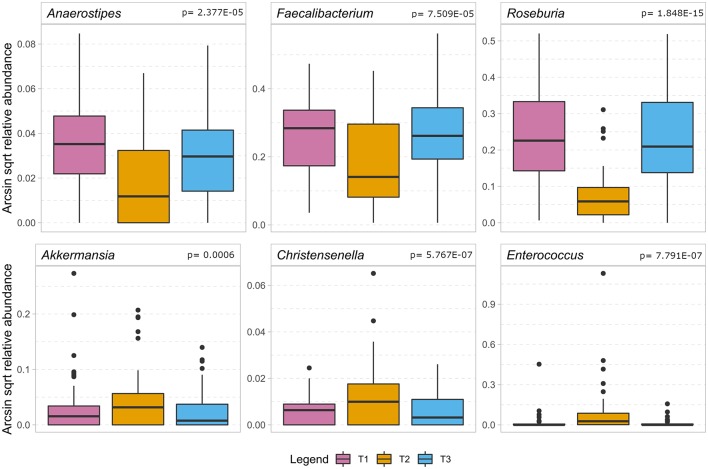
Figure 4.
The boxplot shows the results of the association analysis of the gut microbiota in ICU patients over time. In the top row a selection of beneficial butyrate-producing gut bacteria (for details, cf. Supplementary Material 6) show a significant decrease during the stay at the intensive care unit. In the bottom row we show bacteria that significantly increase during hospitalization of which Enterococcus is considered a pathobiont while the other two are regarded as beneficial to gut health. In the analysis, only taxa remaining after application of FDR < 0.05 are considered significant and the p-value of the quadratic component of the model is depicted in the headings.

