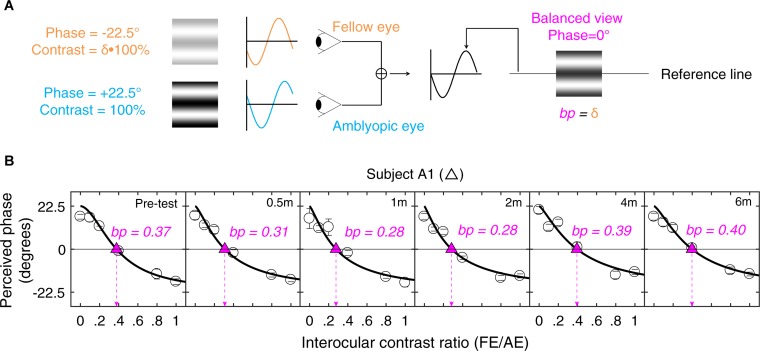
FIGURE 1.
Illustration of the experimental procedure for measuring suppression. (A) Our task for quantifying interocular suppression. Two sine-wave gratings with equal and opposite phase shifts are dichoptically presented to the two eyes. The grating seen by the amblyopic eye has a fixed contrast of 100%, while the grating in the fellow eye has proportionally less contrast (ratio less than 1). Interocular suppression index is quantified by the interocular contrast ratio (fellow eye/amblyopic eye) that is needed to achieve a balanced view where the two eyes are equally effective in binocular viewing, i.e., the binocular perceived phase is 0°. (B) Example of one subject’s data. Each panel shows a function relating binocular perceived phase to the interocular contrast ratio (PvR). This function was measured at the beginning of study and after short-term occlusion (0.5, 1, and 2 months; all patients participated), after medium-term occlusion (4 months; patients A1–A9 participated), and after long-term occlusion (6 months; patients A1–A8 participated). The data were fitted with the attenuation contrast-gain control model (solid curve) to derive the effective contrast ratio at balance point (where there is equal contribution from each eye to the binocular percept), which is marked as filled triangle and dashed arrow line in each panel. The estimate of the effective contrast ratio at balance point (in short, balance point or “bp”) is provided in each panel. An increase of “bp” toward one indicates less interocular suppression, while a decrease of “bp” toward zero indicates more interocular suppression.

