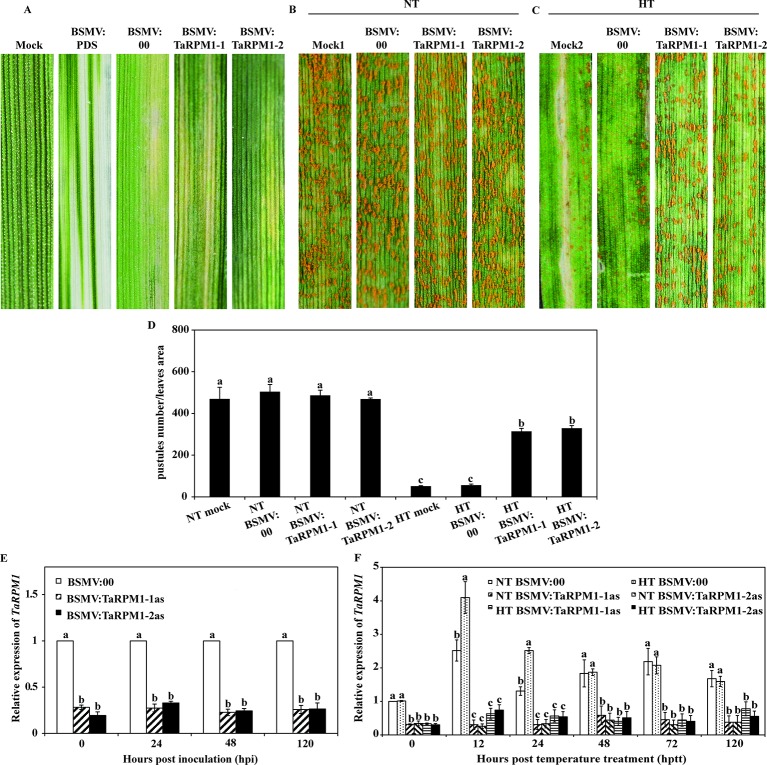
Figure 4.
Functional analysis of TaRPM1 in HTSP resistance to Pst using virus-induced gene silencing assay. (A) Phenotypic observation on the second leaves inoculated with FES buffer (mock), BSMV: TaPDS, BSMV:00, BSMV: TaRPM1-1as, and BSMV: TaRPM1-2as. The mock leaves and leaves pre-inoculated with BSMV virus were all challenged with Pst race CYR32, followed by NT (B) and HT (C) treatment at 192 hpi. (D) Quantification of pustules number in a certain area on different treatment leaves. (E) The relative expression levels of TaRPM1 in silenced and non-silenced leaves infected with CYR32. Leaves were collected at 0, 24, 48, and 120 hpi with CYR32 for RNA extraction and quantitative reverse transcription PCR (qRT-PCR analysis). The TaRPM1 transcript level in non-silenced leaves at every sampled time point was standardized as 1. (F) The relative expression levels of TaRPM1 in the silenced and non-silenced leaves inoculated with CYR32 under NT and HT treatment. RNA samples were isolated from the leaves first infected with barley stripe mosaic virus (BSMV), and then inoculated with CYR32 at 0, 12, 24, 48, 72, and 120 h post-temperature treatment (hptt) (0 hptt: HT was applied, namely 192 hpi). Three independent biological replicates were performed for each treatment and sampling time combination, and three technical replicates for each sample were conducted. The TaRPM1 transcript level in NT-treated non-silenced leaves at 0 hptt was standardized as 1. If the treatments share at least one common lowercase letter at the same time point, the TaRPM1 expression levels do not differ significantly among the these treatments.

