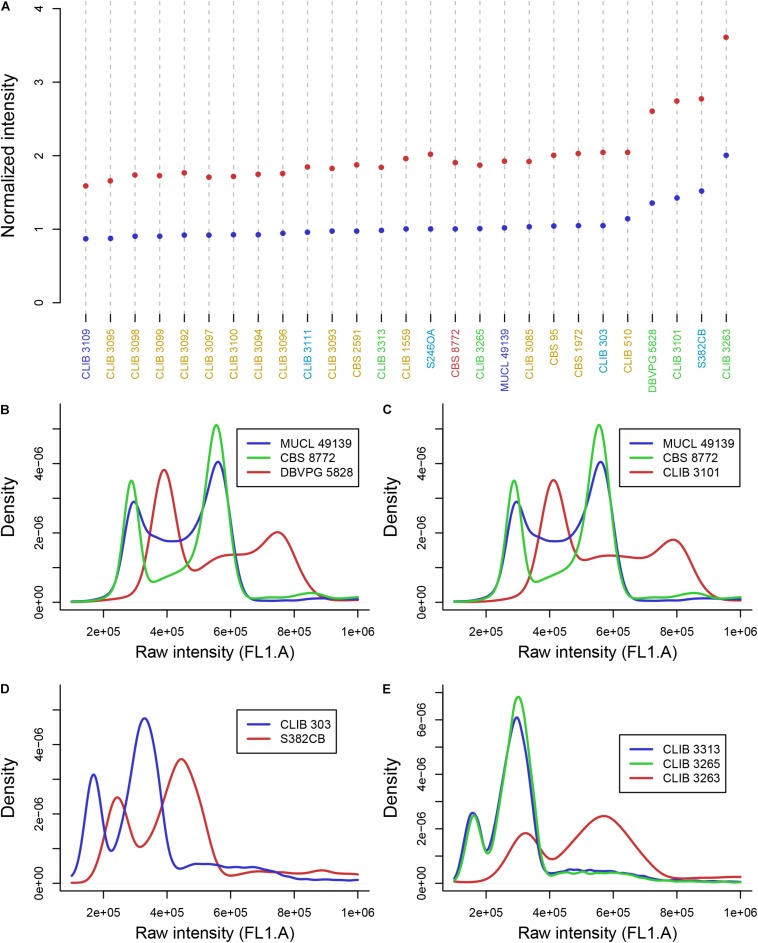
FIGURE 2.
DNA content of Hanseniaspora strains as measured by flow cytometry. (A) Mean intensity of cell DNA at G1 (blue dots) and G2 (red dots) phases, normalized by the intensity of CBS 8772. Species name are colored in blue (H. opuntiae), orange (H. guilliermondii), turquoise (H. uvarum), green (hybrids), dark red (H. pseudoguilliermondii). (B,C,E) Intensity curve of H. opuntiae × H. pseudoguilliermondii hybrids (red) compared to the type strain of the parental species H. opuntiae in blue and H. pseudoguilliermondii in green. (D) Intensity curve of two H. uvarum strains, the type strain CLIB 303 and the triploid strain S382CB.

