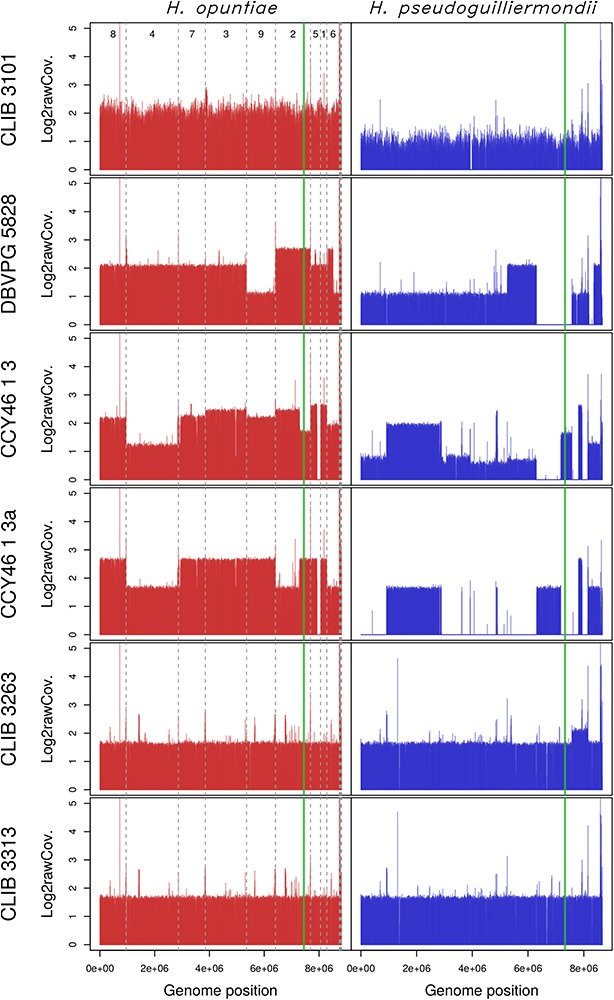
FIGURE 3.

Read coverage from the six hybrid strains along the genomes of the two parental species H. opuntiae (in red) and H. pseudoguilliermondii (in blue). Reference scaffolds were reordered beforehand so that the genome relative position (x-axis) is directly comparable between both parental species. Mean coverage values were computed with SppIDer tool with a sliding-window of 1700 nucleotides (without overlap) and normalized by the mean coverage of Hanseniaspora values present in Supplementary Figure S8. Values are expressed in a log2 scale. Dashed gray lines indicate scaffold boundaries. The vertical green line indicates the position of the MAT locus in each subgenome.
