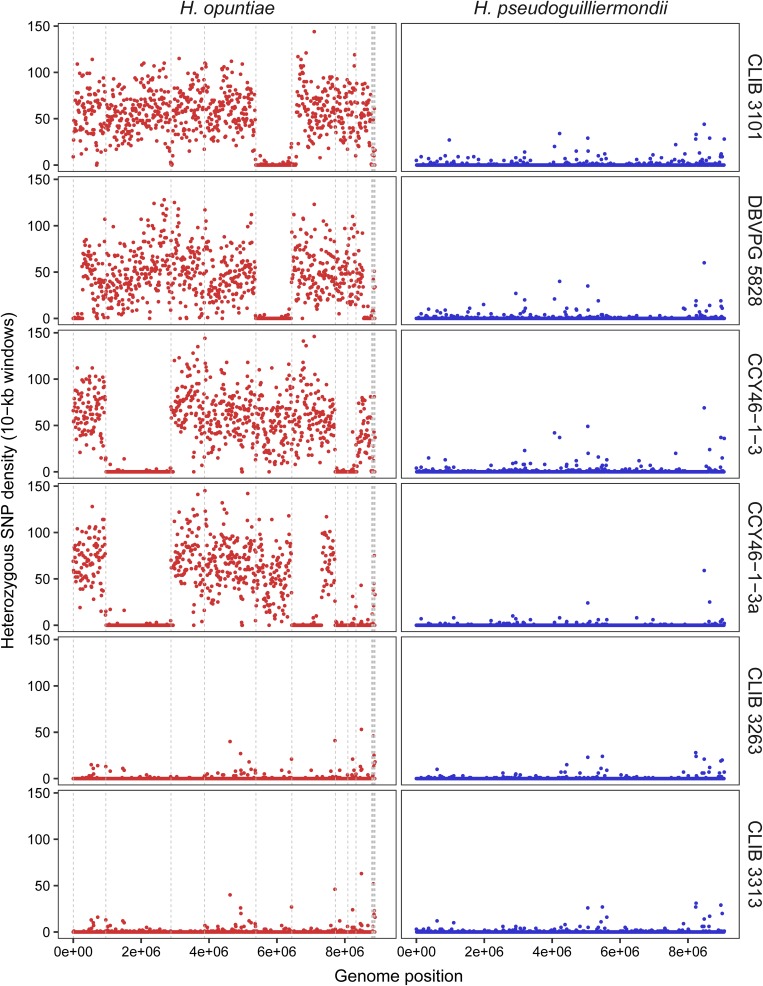
FIGURE 4.
Density of heterozygous SNPs along H. opuntiae and H. pseudoguilliermondii collinearized parental genomes in hybrid strains. Each dot represents the total number of heterozygous SNPs enclosed within 10-kb sliding windows. Scaffold order of reference genomes is the same as in Figure 3. Dashed gray lines indicate scaffold boundaries.

