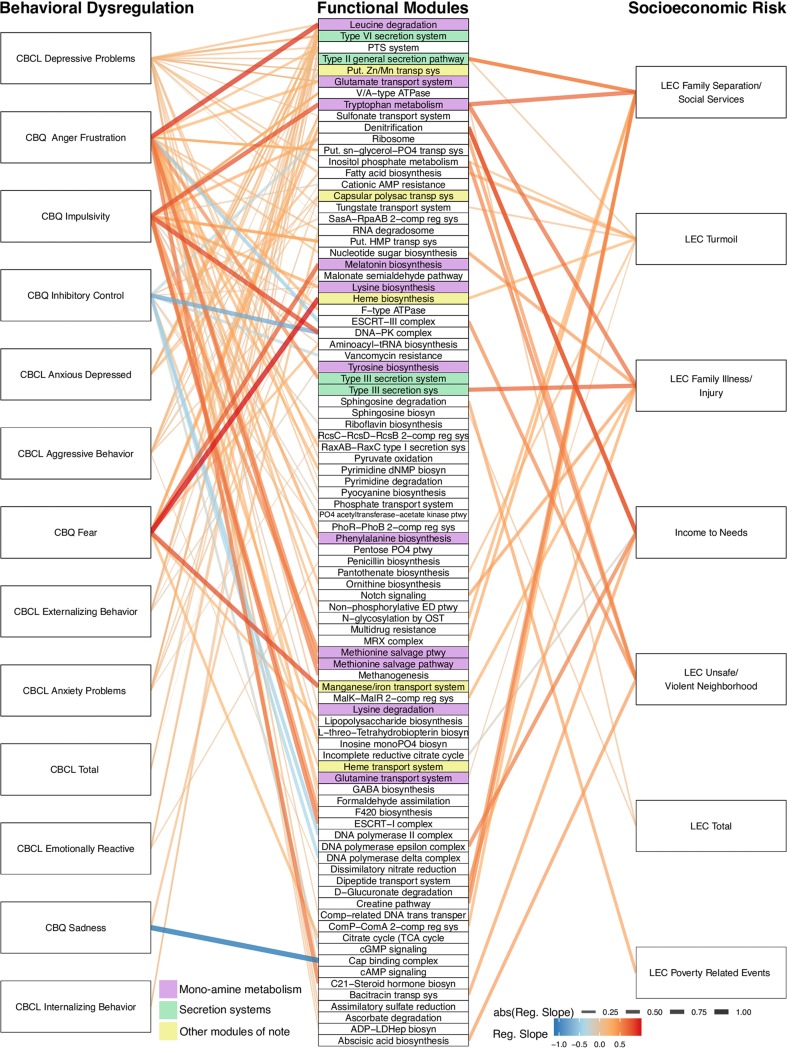
FIG 4.
A network representing statistically significant pairwise associations, according to generalized linear models, between individual KOs (grouped into modules) and behavioral dysregulation or socioeconomic risk covariates. The left column shows individual behavioral dysregulation. The middle column shows functional groups assigned at the KEGG module level. The right column shows individual socioeconomic risk covariates. Lines are drawn between a covariate and a module only if there is a significant relationship. The color of the line represents whether the association between the covariate and module is negative (blue) or positive (red). The width and intensity of the line color represent the slope of the regression line that describes the association (steeper regression lines are wider and brighter).

